This article is intended to provide the reader with an understanding of currently available technology for approaching water pollution control, building on the discussion of trends and occurrence provided by Hespanhol and Helmer in the chapter Environmental Health Hazards. The following sections address the control of water pollution problems, first under the heading “Surface Water Pollution Control” and then under the heading “Groundwater Pollution Control”.
Surface Water Pollution Control
Definition of water pollution
Water pollution refers to the qualitative state of impurity or uncleanliness in hydrologic waters of a certain region, such as a watershed. It results from an occurrence or process which causes a reduction in the utility of the earth’s waters, especially as related to human health and environmental effects. The pollution process stresses the loss of purity through contamination, which further implies intrusion by or contact with an outside source as the cause. The term tainted is applied to extremely low levels of water pollution, as in their initial corruption and decay. Defilement is the result of pollution and suggests violation or desecration.
Hydrologic waters
The earth’s natural waters may be viewed as a continuously circulating system as shown in figure 1, which provides a graphic illustration of waters in the hydrologic cycle, including both surface and subsurface waters.
Figure 1. The hydrologic cycle
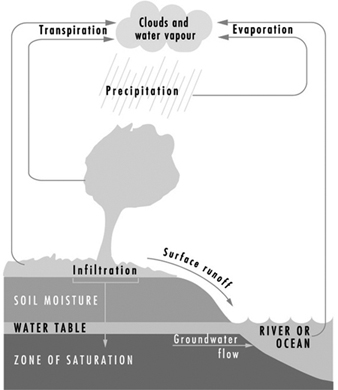
As a reference for water quality, distilled waters (H2O) represent the highest state of purity. Waters in the hydrologic cycle may be viewed as natural, but are not pure. They become polluted from both natural and human activities. Natural degradation effects may result from a myriad of sources - from fauna, flora, volcano eruptions, lightning strikes causing fires and so on, which on a long-term basis are considered to be prevailing background levels for scientific purposes.
Human-made pollution disrupts the natural balance by superimposing waste materials discharged from various sources. Pollutants may be introduced into the waters of the hydrologic cycle at any point. For example: atmospheric precipitation (rainfall) may become contaminated by air pollutants; surface waters may become polluted in the runoff process from watersheds; sewage may be discharged into streams and rivers; and groundwaters may become polluted through infiltration and underground contamination.
Figure 2 shows a distribution of hydrologic waters. Pollution is then superimposed on these waters and may therefore be viewed as an unnatural or unbalanced environmental condition. The process of pollution may occur in waters of any part of the hydrologic cycle, and is more obvious on the earth’s surface in the form of runoff from watersheds into streams and rivers. However groundwater pollution is also of major environmental impact and is discussed following the section on surface water pollution.
Figure 2. Distribution of precipitation
Watershed sources of water pollution
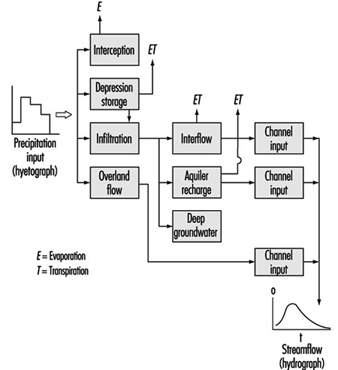
Watersheds are the originating domain of surface water pollution. A watershed is defined as an area of the earth’s surface on which hydrologic waters fall, accumulate, are used, disposed of, and eventually are discharged into streams, rivers or other bodies of water. It is comprised of a drainage system with ultimate runoff or collection in a stream or river. Large river watersheds are usually referred to as drainage basins. Figure 3 is a representation of the hydrologic cycle on a regional watershed. For a region, the disposition of the various waters can be written as a simple equation, which is the basic equation of hydrology as written by Viessman, Lewis and Knapp (1989); typical units are mm/year:
P - R - G - E - T = ±S
where:
P = precipitation (i.e., rainfall, snowfall, hail)
R = runoff or watershed surface flow
G = groundwater
E = evaporation
T = transpiration
S = surface storage
Figure 3. Regional hydrologic cycle
Precipitation is viewed as the initiating form in the above hydrologic budget. The term runoff is synonymous with stream flow. Storage refers to reservoirs or detention systems which collect waters; for example, a human-made dam (barrage) on a river creates a reservoir for purposes of water storage. Groundwater collects as a storage system and may flow from one location to another; it may be influent or effluent in relation to surface streams. Evaporation is a water surface phenomenon, and transpiration is associated with transmission from biota.
Although watersheds may vary greatly in size, certain drainage systems for water pollution designation are classified as urban or non-urban (agricultural, rural, undeveloped) in character. Pollution occurring within these drainage systems originates from the following sources:
Point sources: waste discharges into a receiving water body at a specific location, at a point such as a sewer pipe or some type of concentrated system outlet.
Non-point (dispersed) sources: pollution entering a receiving water body from dispersed sources in the watershed; uncollected rainfall runoff water drainage into a stream is typical. Non-point sources are also sometimes referred to as “diffuse” waters; however, the term dispersed is seen as more descriptive.
Intermittent sources: from a point or source which discharges under certain circumstances, such as with overloaded conditions; combined sewer overflows during heavy rainfall runoff periods are typical.
Water pollutants in streams and rivers
When deleterious waste materials from the above sources are discharged into streams or other bodies of water, they become pollutants which have been classified and described in a previous section. Pollutants or contaminants which enter a body of water can be further divided into:
- degradable (non-conservative) pollutants: impurities which eventually decompose into harmless substances or which may be removed by treatment methods; that is, certain organic materials and chemicals, domestic sewage, heat, plant nutrients, most bacteria and viruses, certain sediments
- non-degradable (conservative) pollutants: impurities which persist in the water environment and do not reduce in concentration unless diluted or removed through treatment; that is, certain organic and inorganic chemicals, salts, colloidal suspensions
- hazardous waterborne pollutants: complex forms of deleterious wastes including toxic trace metals, certain inorganic and organic compounds
- radionuclide pollutants: materials which have been subjected to a radioactive source.
Water pollution control regulations
Broadly applicable water pollution control regulations are generally promulgated by national governmental agencies, with more detailed regulations by states, provinces, municipalities, water districts, conservation districts, sanitation commissions and others. At the national and state (or province) levels, environmental protection agencies (EPAs) and ministries of health are usually charged with this responsibility. In the discussion of regulations below, the format and certain portions follow the example of the water quality standards currently applicable for the US State of Ohio.
Water quality use designations
The ultimate goal in the control of water pollution would be zero discharge of pollutants to water bodies; however, complete achievement of this objective is usually not cost effective. The preferred approach is to set limitations on waste disposal discharges for the reasonable protection of human health and the environment. Although these standards may vary widely in different jurisdictions, use designations for specific bodies of water are commonly the basis, as briefly addressed below.
Water supplies include:
- public water supply: waters which with conventional treatment will be suitable for human consumption
- agricultural supply: waters suitable for irrigation and livestock watering without treatment
- industrial/commercial supply: waters suitable for industrial and commercial uses with or without treatment.
Recreational activities include:
- bathing waters: waters which during certain seasons are suitable for swimming as approved for water quality along with protective conditions and facilities
- primary contact: waters which during certain seasons are suitable for full body contact recreation such as swimming, canoeing and underwater diving with minimal threat to public health as a result of water quality
- secondary contact: waters which during certain seasons are suitable for partial body contact recreation such as, but not limited to, wading, with minimal threat to public health as a result of water quality.
Public water resources are categorized as water bodies which lie within park systems, wetland, wildlife areas, wild, scenic and recreational rivers and publicly owned lakes, and waters of exceptional recreational or ecological significance.
Aquatic life habitats
Typical designations will vary according to climates, but relate to conditions in water bodies for supporting and maintaining certain aquatic organisms, especially various species of fish. For example, use designations in a temperate climate as subdivided in regulations for the State of Ohio Environmental Protection Agency (EPA) are listed below without detailed descriptions:
- warmwater
- limited warmwater
- exceptional warmwater
- modified warmwater
- seasonal salmonid
- coldwater
- limited resource water.
Water pollution control criteria
Natural waters and wastewaters are characterized in terms of their physical, chemical and biological composition. The principal physical properties and the chemical and biological constituents of wastewater and their sources are a lengthy list, reported in a textbook by Metcalf and Eddy (1991). Analytical methods for these determinations are given in a widely used manual entitled Standard Methods for the Examination of Water and Waste Water by the American Public Health Association (1995).
Each designated water body should be controlled according to regulations which may be comprised of both basic and more detailed numerical criteria as briefly discussed below.
Basic freedom from pollution. To the extent practical and possible, all bodies of water should attain the basic criteria of the “Five Freedoms from Pollution”:
- free from suspended solids or other substances that enter the waters as a result of human activity and that will settle to form putrid or otherwise objectionable sludge deposits, or that will adversely affect aquatic life
- free from floating debris, oil, scum and other floating materials entering the waters as a result of human activity in amounts sufficient to be unsightly or cause degradation
- free from materials entering the waters as a result of human activity, producing colour, odour or other conditions in such degree as to create a nuisance
- free from substances entering the waters as a result of human activity, in concentrations that are toxic or harmful to human, animal or aquatic life and/or are rapidly lethal in the mixing zone
- free from nutrients entering the waters as a result of human activity, in concentrations that create nuisance growths of aquatic weeds and algae.
Water quality criteria are numerical limitations and guidelines for the control of chemical, biological and toxic constituents in bodies of water.
With over 70,000-plus chemical compounds in use today it is impractical to specify the control of each. However, criteria for chemicals can be established on the basis of limitations as they first of all relate to three major classes of consumption and exposure:
Class 1: Chemical criteria for protection of human health are of first major concern and should be set according to recommendations from governmental health agencies, the WHO and recognized health research organizations.
Class 2: Chemical criteria for control of agricultural water supply should be based on recognized scientific studies and recommendations which will protect against adverse effects on crops and livestock as a result of crop irrigation and livestock watering.
Class 3: Chemical criteria for protection of aquatic life should be based on recognized scientific studies regarding the sensitivity of these species to specific chemicals and also as related to human consumption of fish and sea foods.
Wastewater effluent criteria relate to limitations on pollutant constituents present in wastewater effluents and are a further method of control. They may be set as related to the water use designations of bodies of water and as they relate to the above classes for chemical criteria.
Biological criteria are based on water body habitat conditions which are needed to support aquatic life.
Organic content of wastewaters and natural waters
The gross content of organic matter is most important in characterizing the pollutional strength of both wastewater and natural waters. Three laboratory tests are commonly used for this purpose:
Biochemical oxygen demand (BOD): five-day BOD (BOD5) is the most widely used parameter; this test measures the dissolved oxygen used by micro-organisms in the biochemical oxidation of organic matter over this period.
Chemical oxygen demand (COD): this test is to measure the organic matter in municipal and industrial wastes that contain compounds that are toxic to biological life; it is a measure of the oxygen equivalent of the organic matter that can be oxidized.
Total organic carbon (TOC): this test is especially applicable to small concentrations of organic matter in water; it is a measure of the organic matter that is oxidized to carbon dioxide.
Antidegradation policy regulations
Antidegradation policy regulations are a further approach for preventing the spread of water pollution beyond certain prevailing conditions. As an example, the Ohio Environmental Protection Agency Water Quality Standards antidegradation policy consists of three tiers of protection:
Tier 1: Existing uses must be maintained and protected. No further water quality degradation is allowed that would interfere with existing designated uses.
Tier 2: Next, water quality better than that needed to protect uses must be maintained unless it is shown that a lower water quality is necessary for important economic or social development, as determined by the EPA Director.
Tier 3: Finally, the quality of water resource waters must be maintained and protected. Their existing ambient water quality is not to be degraded by any substances determined to be toxic or to interfere with any designated use. Increased pollutant loads are allowed to be discharged into water bodies if they do not result in lowering existing water quality.
Water pollution discharge mixing zones and waste load allocation modelling
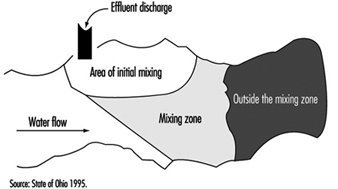
Mixing zones are areas in a body of water which allow for treated or untreated wastewater discharges to attain stabilized conditions, as illustrated in figure 4 for a flowing stream. The discharge is initially in a transitory state which becomes progressively diluted from the source concentration to the receiving water conditions. It is not to be considered as a treatment entity and may be delineated with specific restrictions.
Figure 4. Mixing zones
Typically, mixing zones must not:
- interfere with migration, survival, reproduction or growth of aquatic species
- include spawning or nursery areas
- include public water supply intakes
- include bathing areas
- constitute more than 1/2 the width of a stream
- constitute more than 1/2 the cross-sectional area of a stream mouth
- extend downstream for a distance more than five times the stream width.
Waste load allocation studies have become important because of the high cost of nutrient control of wastewater discharges to avoid instream eutrophication (defined below). These studies generally employ the use of computer models for simulation of water quality conditions in a stream, particularly with regard to nutrients such as forms of nitrogen and phosphorous, which affect the dissolved oxygen dynamics. Traditional water quality models of this type are represented by the US EPA model QUAL2E, which has been described by Brown and Barnwell (1987). A more recent model proposed by Taylor (1995) is the Omni Diurnal Model (ODM), which includes a simulation of the impact of rooted vegetation on instream nutrient and dissolved oxygen dynamics.
Variance provisions
All water pollution control regulations are limited in perfection and therefore should include provisions which allow for judgemental variance based on certain conditions which may prevent immediate or complete compliance.
Risk assessment and management as related to water pollution
The above water pollution control regulations are typical of worldwide governmental approaches for achieving compliance with water quality standards and wastewater effluent discharge limits. Generally these regulations have been set on the basis of health factors and scientific research; where some uncertainty exists as to possible effects, safety factors often are applied. Implementation of certain of these regulations may be unreasonable and exceedingly costly for the public at large as well as for private enterprise. Therefore there is a growing concern for more efficient allocation of resources in achieving goals for water quality improvement. As previously pointed out in the discussion of hydrologic waters, pristine purity does not exist even in naturally occurring waters.
A growing technological approach encourages assessment and management of ecological risks in the setting of water pollution regulations. The concept is based on an analysis of the ecological benefits and costs in meeting standards or limits. Parkhurst (1995) has proposed the application of aquatic ecological risk assessment as an aid in setting water pollution control limits, particularly as applicable for the protection of aquatic life. Such risk assessment methods may be applied to estimate the ecological effects of chemical concentrations for a broad range of surface water pollution conditions including:
- point source pollution
- non-point source pollution
- existing contaminated sediments in stream channels
- hazardous wastes sites as related to water bodies
- analysis of existing water pollution control criteria.
The proposed method consists of three tiers; as shown in figure 5 which illustrates the approach.
Figure 5. Methods for conducting risk assessment for successive tiers of analysis. Tier 1: Screening level; Tier 2: Quantification of potentially significant risks ; Tier 3: Site-specific risk quantification

Water pollution in lakes and reservoirs
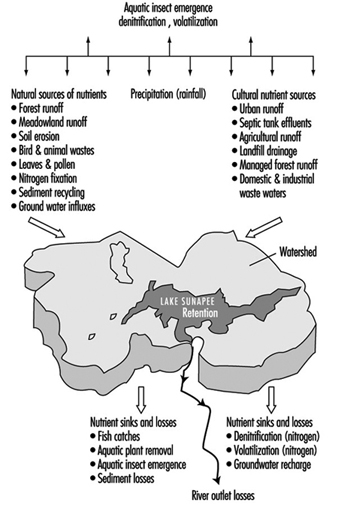
Lakes and reservoirs provide for the volumetric storage of watershed inflow and may have long flushing time periods as compared with the rapid inflow and outflow for a reach in a flowing stream. Therefore they are of special concern with regard to the retention of certain constituents, especially nutrients including forms of nitrogen and phosphorous which promote eutrophication. Eutrophication is a natural ageing process in which the water content becomes organically enriched, leading to the domination of undesirable aquatic growth, such as algae, water hyacinth and so on. The eutrophic process tends to decrease aquatic life and has detrimental dissolved oxygen effects. Both natural and cultural sources of nutrients may promote the process, as illustrated by Preul (1974) in figure 6, showing a schematic listing of nutrient sources and sinks for Lake Sunapee, in the US State of New Hampshire.
Figure 6. Schematic listing of nutrient (nitrogen and phosphorus) sources and sinks for Lake Sunapee, New Hampshire (US)
Lakes and reservoirs, of course, can be sampled and analysed to determine their trophic status. Analytical studies usually start with a basic nutrient balance such as the following:
(lake influent nutrients) = (lake effluent nutrients) + (nutrient retention in lake)
This basic balance can be further expanded to include the various sources shown in figure 6.
Flushing time is an indication of the relative retention aspects of a lake system. Shallow lakes, such as Lake Erie, have relatively short flushing times and are associated with advanced eutrophication because shallow lakes often are more conducive to aquatic plant growth. Deep lakes such as Lake Tahoe and Lake Superior have very long flushing periods, which are usually associated with lakes with minimal eutrophication because up to the present time, they have not been overloaded and also because their extreme depths are not conducive to extensive aquatic plant growth except in the epilimnion (upper zone). Lakes in this category are generally classified as oligotrophic, on the basis that they are relatively low in nutrients and support minimal aquatic growth such as algae.
It is of interest to compare the flushing times of some major US lakes as reported by Pecor (1973) using the following calculation basis:
lake flushing time (LFT) = (lake storage volume)/(lake outflow)
Some examples are: Lake Wabesa (Michigan), LFT=0.30 years; Houghton Lake (Michigan), 1.4 years; Lake Erie, 2.6 years; Lake Superior, 191 years; Lake Tahoe, 700 years.
Although the relationship between the process of eutrophication and nutrient content is complex, phosphorous is typically recognized as the limiting nutrient. Based on fully mixed conditions, Sawyer (1947) reported that algal blooms tend to occur if nitrogen values exceed 0.3 mg/l and phosphorous exceeds 0.01 mg/l. In stratified lakes and reservoirs, low dissolved oxygen levels in the hypoliminion are early signs of eutrophication. Vollenweider (1968, 1969) has developed critical loading levels of total phosphorous and total nitrogen for a number of lakes based on nutrient loadings, mean depths and trophic states. For a comparison of work on this subject, Dillon (1974) has published a critical review of Vollenweider’s nutrient budget model and other related models. More recent computer models are also available for simulating nitrogen/phosphorous cycles with temperature variations.
Water pollution in estuaries
An estuary is an intermediate passageway of water between the mouth of a river and a sea coast. This passageway is comprised of a river mouth channel reach with river inflow (fresh water) from upstream and outflow discharge on the downstream side into a constantly changing tailwater level of sea water (salt water). Estuaries are continuously affected by tidal fluctuations and are among the most complex bodies of water encountered in water pollution control. The dominant features of an estuary are variable salinity, a salt wedge or interface between salt and fresh water, and often large areas of shallow, turbid water overlying mud flats and salt marshes. Nutrients are largely supplied to an estuary from the inflowing river and combine with the sea water habitat to provide prolific production of biota and sea life. Especially desired are seafoods harvested from estuaries.
From a water pollution standpoint, estuaries are individually complex and generally require special investigations employing extensive field studies and computer modelling. For a further basic understanding, the reader is referred to Reish 1979, on marine and estuarine pollution; and to Reid and Wood 1976, on the ecology of inland waters and estuaries.
Water pollution in marine environments
Oceans may be viewed as the ultimate receiving water or sink, since wastes carried by rivers finally discharge into this marine environment. Although oceans are vast bodies of salt water with seemingly unlimited assimilation capacity, pollution tends to blight coastlines and further affects marine life.
Sources of marine pollutants include many of those encountered in land-based wastewater environments plus more as related to marine operations. A limited list is given below:
- domestic sewage and sludge, industrial wastes, solid wastes, shipboard wastes
- fishery wastes, sediments and nutrients from rivers and land runoff
- oil spills, offshore oil exploration and production wastes, dredge operations
- heat, radioactive wastes, waste chemicals, pesticides and herbicides.
Each of the above requires special handling and methods of control. The discharge of domestic sewage and sewage sludges through ocean outfalls is perhaps the major source of marine pollution.
For current technology on this subject, the reader is referred to the book on marine pollution and its control by Bishop (1983).
Techniques for reducing pollution in wastewater discharges
Large-scale wastewater treatment is typically carried out by municipalities, sanitary districts, industries, commercial enterprises and various pollution control commissions. The purpose here is to describe contemporary methods of municipal wastewater treatment and then to provide some insights regarding treatment of industrial wastes and more advanced methods.
In general, all processes of wastewater treatment may be grouped into physical, chemical or biological types, and one or more of these may be employed to achieve a desired effluent product. This classification grouping is most appropriate in the understanding of wastewater treatment approaches and is tabulated in table 1.
Table 1. General classification of wastewater treatment operations and processes
|
Physical Operations |
Chemical Processes |
Biological Processes |
|
Flow measurement |
Precipitation |
Aerobic action |
Contemporary methods of wastewater treatment
The coverage here is limited and is intended to provide a conceptual overview of current wastewater treatment practices around the world rather than detailed design data. For the latter, the reader is referred to Metcalf and Eddy 1991.
Municipal wastewaters along with some intermingling of industrial/commercial wastes are treated in systems commonly employing primary, secondary and tertiary treatment as follows:
Primary treatment system: Pre-treat ® Primary settling ® Disinfection (chlorination) ® Effluent
Secondary treatment system: Pre-treat ® Primary settling ® Biological unit ® Second settling ® Disinfection (chlorination) ® Effluent to stream
Tertiary treatment system: Pre-treat ® Primary settling ® Biological unit ® Second settling ® Tertiary unit ® Disinfection (chlorination) ® Effluent to stream
Figure 7 further shows a schematic diagram of a conventional wastewater treatment system. Overview descriptions of the above processes follow.
Figure 7. Schematic diagram of conventional wastewater treatment
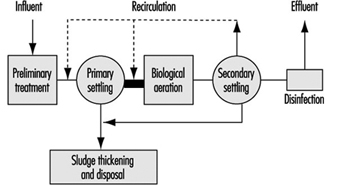
Primary treatment
The basic objective of primary treatment for municipal wastewaters, including domestic sewage intermingled with some industrial/commercial wastes, is to remove suspended solids and clarify the wastewater, to make it suitable for biological treatment. After some pre-treatment handling such as screening, grit removal and comminution, the main process of primary sedimentation is the settling of the raw wastewater in large settling tanks for periods up to several hours. This process removes from 50 to 75% of the total suspended solids, which are drawn off as an underflow sludge collected for separate treatment. The overflow effluent from the process then is directed for secondary treatment. In certain cases, chemicals may be employed to improve the degree of primary treatment.
Secondary treatment
The portion of the organic content of the wastewater which is finely suspended or dissolved and not removed in the primary process, is treated by secondary treatment. The generally accepted forms of secondary treatment in common use include trickling filters, biological contactors such as rotating discs, activated sludge, waste stabilization ponds, aerated pond systems and land application methods, including wetland systems. All of these systems will be recognized as employing biological processes of some form or another. The most common of these processes are briefly discussed below.
Biological contactor systems. Trickling filters are one of the earliest forms of this method for secondary treatment and are still widely used with some improved methods of application. In this treatment, the effluent from the primary tanks is applied uniformly onto a bed of media, such as rock or synthetic plastic media. Uniform distribution is accomplished typically by trickling the liquid from perforated piping rotated over the bed intermittently or continuously according to the desired process. Depending on the rate of organic and hydraulic loadings, trickling filters can remove up to 95% of the organic content, usually analysed as biochemical oxygen demand (BOD). There are numerous other more recent biological contactor systems in use which can provide treatment removals in the same range; some of these methods offer special advantages, particularly applicable in certain limiting conditions such as space, climate and so on. It is to be noted that a following secondary settling tank is considered to be a necessary part of completing the process. In secondary settling, some so-called humus sludge is drawn off as an underflow, and the overflow is discharged as a secondary effluent.
Activated sludge. In the most common form of this biological process, primary treated effluent flows into an activated sludge unit tank containing a previously existing biological suspension called activated sludge. This mixture is referred to as mixed liquor suspended solids (MLSS) and is provided a contact period typically ranging from several hours up to 24 hours or more, depending on the desired results. During this period the mixture is highly aerated and agitated to promote aerobic biological activity. As the process finalizes, a portion of the mixture (MLSS) is drawn off and returned to the influent for continuation of the biological activation process. Secondary settling is provided following the activated sludge unit for the purpose of settling out the activated sludge suspension and discharging a clarified overflow as an effluent. The process is capable of removing up to about 95% of the influent BOD.
Tertiary treatment
A third level of treatment may be provided where a higher degree of pollutant removal is required. This form of treatment may typically include sand filtration, stabilization ponds, land disposal methods, wetlands and other systems which further stabilize the secondary effluent.
Disinfection of effluents
Disinfection is commonly required to reduce bacteria and pathogens to acceptable levels. Chlorination, chlorine dioxide, ozone and ultraviolet light are the most commonly used processes.
Overall wastewater treatment plant efficiency
Wastewaters include a broad range of constituents which generally are classified as suspended and dissolved solids, inorganic constituents and organic constituents.
The efficiency of a treatment system can be measured in terms of the percentage removal of these constituents. Common parameters of measurement are:
- BOD: biochemical oxygen demand, measured in mg/l
- COD: chemical oxygen demand, measured in mg/l
- TSS: total suspended solids, measured in mg/l
- TDS: total dissolved solids, measured in mg/l
- nitrogen forms: including nitrate and ammonia, measured in mg/l (nitrate is of particular concern as a nutrient in eutrophication)
- phosphate: measured in mg/l (also of particular concern as a nutrient in eutrophication)
- pH: degree of acidity, measured as a number from 1 (most acid) to 14 (most alkaline)
- coliform bacteria counts: measured as most probable number per 100 ml (Escherichia and fecal coliform bacteria are most common indicators).
Industrial wastewater treatment
Types of industrial wastes
Industrial (non-domestic) wastes are numerous and vary greatly in composition; they may be highly acidic or alkaline, and often require a detailed laboratory analysis. Specialized treatment may be necessary to render them innocuous before discharge. Toxicity is of great concern in the disposal of industrial wastewaters.
Representative industrial wastes include: pulp and paper, slaughterhouse, brewery, tannery, food processing, cannery, chemical, petroleum, textile, sugar, laundry, meat and poultry, hog feeding, rendering and many others. The initial step in treatment design development is an industrial waste survey, which provides data on variations in flow and waste characteristics. Undesirable waste characteristics as listed by Eckenfelder (1989) can be summarized as follows:
- soluble organics causing depletion of dissolved oxygen
- suspended solids
- trace organics
- heavy metals, cyanide and toxic organics
- colour and turbidity
- nitrogen and phosphorus
- refractory substances resistant to biodegradation
- oil and floating material
- volatile materials.
The US EPA has further defined a list of toxic organic and inorganic chemicals with specific limitations in granting discharge permits. The list includes more than 100 compounds and is too long to reprint here, but may be requested from the EPA.
Treatment methods
The handling of industrial wastes is more specialized than the treatment of domestic wastes; however, where amenable to biological reduction, they are usually treated using methods similar to those previously described (secondary/tertiary biological treatment approaches) for municipal systems.
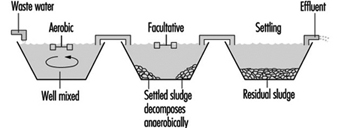
Waste stabilization ponds are a common method of organic wastewater treatment where sufficient land area is available. Flow-through ponds are generally classified according to their bacterial activity as aerobic, facultative or anaerobic. Aerated ponds are supplied with oxygen by diffused or mechanical aeration systems.
Figure 8 and figure 9 show sketches of waste stabilization ponds.
Figure 8. Two-cell stabilization pond: cross sectional diagram
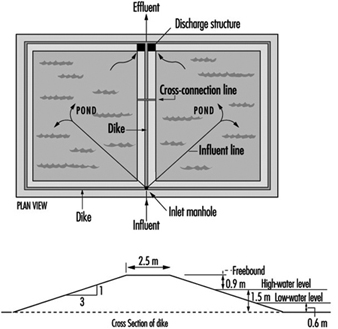
Figure 9. Aerated lagoon types: schematic diagram
Pollution prevention and waste minimization
When industrial waste in-plant operations and processes are analysed at their source, they often can be controlled so as to prevent significant polluting discharges.
Recirculation techniques are important approaches in pollution prevention programmes. A case study example is a recycling plan for a leather tannery wastewater effluent published by Preul (1981), which included chrome recovery/reuse along with the complete recirculation of all tannery wastewaters with no effluent to any stream except in emergencies. The flow diagram for this system is shown in figure 10.
Figure 10. Flow diagram for tannery wastewater effluent recycling system

For more recent innovations in this technology, the reader is referred to a publication on pollution prevention and waste minimization by the Water Environment Federation (1995).
Advanced methods of wastewater treatment
A number of advanced methods are available for higher degrees of removal of pollution constituents as may be required. A general listing includes:
filtration (sand and multimedia)
chemical precipitation
carbon adsorption
electrodialysis
distillation
nitrification
algae harvesting
reclamation of effluents
micro-straining
ammonia stripping
reverse osmosis
ion exchange
land application
denitrification
wetlands.
The most appropriate process for any situation must be determined on the basis of the quality and quantity of the raw wastewater, the receiving water requirements and, of course, costs. For further reference, see Metcalf and Eddy 1991, which includes a chapter on advanced wastewater treatment.
Advanced wastewater treatment case study
The case study of the Dan Region Sewage Reclamation Project discussed elsewhere in this chapter provides an excellent example of innovative methods for wastewater treatment and reclamation.
Thermal pollution
Thermal pollution is a form of industrial waste, defined as deleterious increases or reductions in normal water temperatures of receiving waters caused by the disposal of heat from human-made facilities. The industries producing major waste heat are fossil fuel (oil, gas and coal) and nuclear power generating plants, steel mills, petroleum refineries, chemical plants, pulp and paper mills, distilleries and laundries. Of particular concern is the electric power generating industry which supplies energy for many countries (e.g., about 80% in the US).
Impact of waste heat on receiving waters
Influence on waste assimilation capacity
- Heat increases biological oxidation.
- Heat decreases oxygen saturation content of water and decreases rate of natural reoxygenation.
- The net effect of heat is generally detrimental during warm months of year.
- Winter effect may be beneficial in colder climates, where ice conditions are broken up and surface aeration is provided for fish and aquatic life.
Influence on aquatic life
Many species have temperature tolerance limits and need protection, particularly in heat affected reaches of a stream or body of water. For example, cold water streams usually have the highest type of sport fish such as trout and salmon, whereas warm waters generally support coarse fish populations, with certain species such as pike and bass fish in intermediate temperature waters.
Figure 11. Heat exchange at the boundaries of a receiving water cross section

Thermal analysis in receiving waters
Figure 11 illustrates the various forms of natural heat exchange at the boundaries of a receiving water. When heat is discharged to a receiving water such as a river, it is important to analyse the river capacity for thermal additions. The temperature profile of a river can be calculated by solving a heat balance similar to that used in calculating dissolved oxygen sag curves. The principal factors of the heat balance are illustrated in figure 12 for a river reach between points A and B. Each factor requires an individual calculation dependent on certain heat variables. As with a dissolved oxygen balance, the temperature balance is simply a summation of temperature assets and liabilities for a given section. Other more sophisticated analytical approaches are available in the literature on this subject. The results from the heat balance calculations can be used in establishing heat discharge limitations and possibly certain use constraints for a body of water.
Figure 12. River capacity for thermal additions

Thermal pollution control
The main approaches for the control of thermal pollution are:
- improved power plant operation efficiencies
- cooling towers
- isolated cooling ponds
- consideration of alternative methods of power generation such as hydro-power.
Where physical conditions are favourable within certain environmental limits, hydro-electric power should be considered as an alternative to fossil-fuel or nuclear power generation. In hydro-electric power generation, there is no disposal of heat and there is no discharge of waste waters causing water pollution.
Groundwater Pollution Control
Importance of groundwater
Since the world’s water supplies are widely extracted from aquifers, it is most important that these sources of supply be protected. It is estimated that more than 95% of the earth’s available fresh water supply is underground; in the United States approximately 50% of the drinking water comes from wells, according to the 1984 US Geological Survey. Because underground water pollution and movement are of subtle and unseen nature, less attention sometimes is given to the analysis and control of this form of water degradation than to surface water pollution, which is far more obvious.
Figure 13. Hydrologic cycle and sources of groundwater contamination
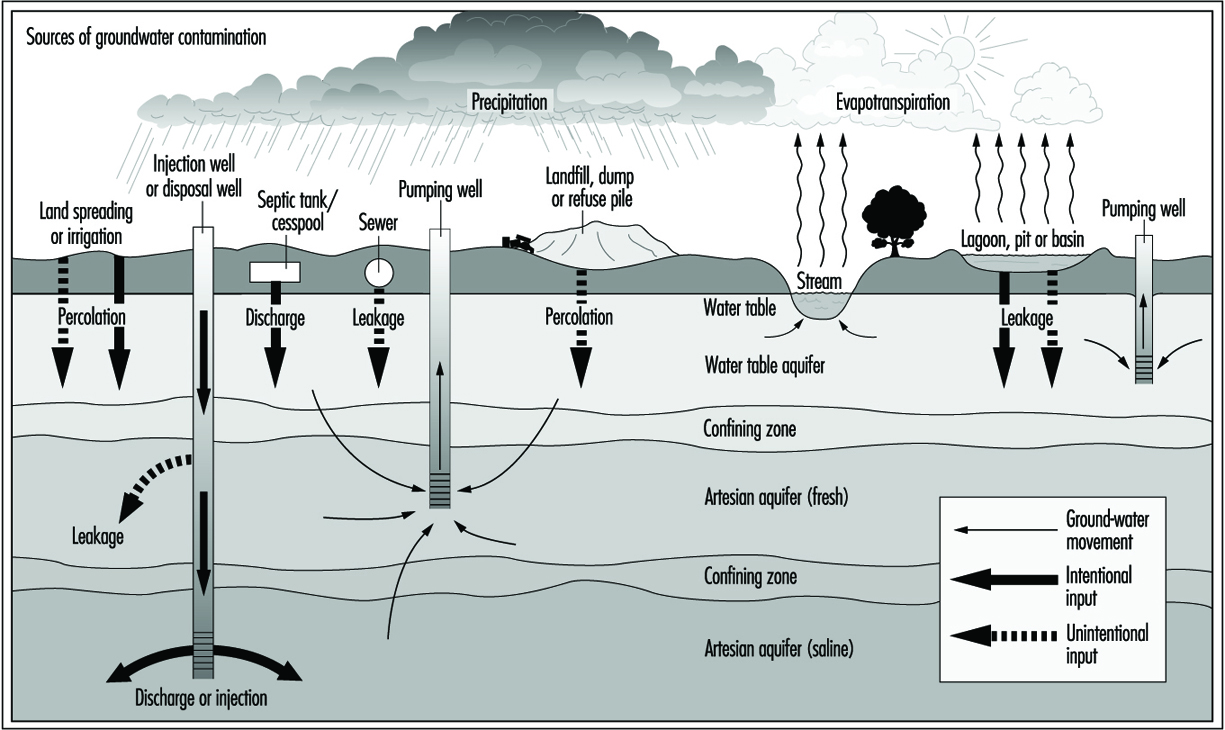
Sources of underground pollution
Figure 13 shows the hydrologic cycle with superimposed sources of groundwater contamination. A complete listing of the potential sources of underground pollution is extensive; however, for illustration the most obvious sources include:
- industrial waste discharges
- polluted streams in contact with aquifers
- mining operations
- solid and hazardous waste disposal
- underground storage tanks such as for petroleum
- irrigation systems
- artificial recharge
- sea water encroachment
- spills
- polluted ponds with permeable bottoms
- disposal wells
- septic tank tile fields and leaching pits
- improper well drilling
- agricultural operations
- roadway de-icing salts.
Specific pollutants in underground contamination are further categorized as:
- undesirable chemical constituents (typical, not complete list) - organic and inorganic (e.g., chloride, sulphate, iron, manganese, sodium, potassium)
- total hardness and total dissolved solids
- toxic constituents (typical, not complete list) - nitrate, arsenic, chromium, lead, cyanide, copper, phenols, dissolved mercury
- undesirable physical characteristics - taste, colour and odour
- pesticides and herbicides - chlorinated hydrocarbons and others
- radioactive materials - various forms of radioactivity
- biological - bacteria, viruses, parasites and so on
- acid (low pH) or caustic (high pH).
Of the above, nitrates are of special concern in both ground waters and surface waters. In groundwater supplies, nitrates can cause the disease methaemoglobinaemia (infant cyanosis). They further cause detrimental eutrophication effects in surface waters and occur in a wide range of water resources, as reported by Preul (1991). Preul (1964, 1967, 1972) and Preul and Schroepfer (1968) have also reported on the underground movement of nitrogen and other pollutants.
Pollution travel in underground domain
Groundwater movement is exceedingly slow and subtle as compared with the travel of surface waters in the hydrologic cycle. For a simple understanding of the travel of ordinary groundwater under ideal steady flow conditions, Darcy’s Law is the basic approach for the evaluation of groundwater movement at low Reynolds numbers (R):
V = K(dh/dl)
where:
V = velocity of groundwater in aquifer, m/day
K = coefficient of permeability of aquifer
(dh/dl) = hydraulic gradient which represents the driving force for movement.
In pollutant travel underground, ordinary groundwater (H2O) is generally the carrying fluid and can be calculated to move at a rate according to the parameters in Darcy’s Law. However, the rate of travel or velocity of a pollutant, such as an organic or inorganic chemical, may be different due to advection and hydrodynamic dispersion processes. Certain ions move slower or faster than the general rate of groundwater flow as a result of reactions within the aquifer media, so that they can be categorized as “reacting” or “non-reacting”. Reactions are generally of the following forms:
- physical reactions between the pollutant and the aquifer and/or the transporting liquid
- chemical reactions between the pollutant and the aquifer and/or the transporting liquid
- biological actions on the pollutant.
The following are typical of reacting and non-reacting underground pollutants:
- reacting pollutants - chromium, ammonium ion, calcium, sodium, iron and so on; cations in general; biological constituents; radioactive constituents
- non-reacting pollutants - chloride, nitrate, sulphate and so on; certain anions; certain pesticide and herbicide chemicals.
At first, it might seem that reacting pollutants are the worst type, but this may not always be the case because the reactions detain or retard pollutant travel concentrations whereas non-reacting pollutant travel may be largely uninhibited. Certain “soft” domestic and agricultural products are now available which biologically degrade after a period of time and therefore avoid the possibility of groundwater contamination.
Aquifer remediation
Prevention of underground pollution is obviously the best approach; however, uncontrolled existence of polluted groundwater conditions usually is made known after its occurrence, such as by complaints from water well users in the area. Unfortunately, by the time the problem is recognized, severe damage may have occurred and remediation is necessary. Remediation may require extensive hydro-geological field investigations with laboratory analyses of water samples in order to establish the extent of pollutant concentrations and travel plumes. Often existing wells can be used in initial sampling, but severe cases may require extensive borings and water samplings. These data can then be analysed to establish current conditions and to make future condition predictions. The analysis of groundwater contamination travel is a specialized field often requiring the use of computer models to better understand the groundwater dynamics and to make predictions under various constraints. A number of two- and three-dimensional computer models are available in the literature for this purpose. For more detailed analytical approaches, the reader is referred to the book by Freeze and Cherry (1987).
Pollution prevention
The preferred approach for the protection of groundwater resources is pollution prevention. Although drinking water standards generally apply to the use of groundwater supplies, the raw water supplies require protection from contamination. Governmental entities such as ministries of health, natural resources agencies, and environmental protection agencies are generally responsible for such activities. Groundwater pollution control efforts are largely directed at protection of aquifers and the prevention of pollution.
Pollution prevention requires land-use controls in the form of zoning and certain regulations. Laws may apply to the prevention of specific functions as particularly applicable to point sources or actions which potentially may cause pollution. Control by land-use zoning is a groundwater protection tool which is most effective at the municipal or county level of government. Aquifer and wellhead protection programmes as discussed below are leading examples of pollution prevention.
An aquifer protection programme requires establishing the boundaries of the aquifer and its recharge areas. Aquifers may be of an unconfined or confined type, and therefore need to be analysed by a hydrologist to make this determination. Most major aquifers are generally well known in developed countries, but other areas may require field investigations and hydrogeologic analysis. The key element of the programme in the protection of the aquifer from water quality degradation is control of land use over the aquifer and its recharge areas.
Wellhead protection is a more definitive and limited approach which applies to the recharge area contributing to a particular well. The US federal government by amendments passed in 1986 to the Safe Drinking Water Act (SDWA) (1984) now requires that specific wellhead protection areas be established for public supply wells. The wellhead protection area (WHPA) is defined in the SDWA as “the surface and subsurface area surrounding a water well or well field, supplying a public water supply system, through which contaminants are reasonably likely to move toward and reach such water well or well field.” The main objective in the WHPA programme, as outlined by the US EPA (1987), is the delineation of well protection areas based on selected criteria, well operation and hydrogeologic considerations.