Heat stress occurs when a person’s environment (air temperature, radiant temperature, humidity and air velocity), clothing and activity interact to produce a tendency for body temperature to rise. The body’s thermoregulatory system then responds in order to increase heat loss. This response can be powerful and effective, but it can also produce a strain on the body which leads to discomfort and eventually to heat illness and even death. It is important therefore to assess hot environments to ensure the health and safety of workers.
Heat stress indices provide tools for assessing hot environments and predicting likely thermal strain on the body. Limit values based upon heat stress indices will indicate when that strain is likely to become unacceptable.
The mechanisms of heat stress are generally understood, and work practices for hot environments are well established. These include knowledge of the warning signs of heat stress, acclimatization programmes and water replacement. There are still many casualties, however, and these lessons seem to have to be relearned.
In 1964, Leithead and Lind described an extensive survey and concluded that heat disorders occur for one or more of the following three reasons:
- the existence of factors such as dehydration or lack of acclimatization
- the lack of proper appreciation of the dangers of heat, either on the part of the supervising authority or of the individuals at risk
- accidental or unforeseeable circumstances leading to exposure to very high heat stress.
They concluded that many deaths can be attributed to neglect and lack of consideration and that even when disorders do occur, much can be done if all the requirements for the correct and prompt remedial treatment are available.
Heat Stress Indices
A heat stress index is a single number which integrates the effects of the six basic parameters in any human thermal environment such that its value will vary with the thermal strain experienced by the person exposed to a hot environment. The index value (measured or calculated) can be used in design or in work practice to establish safe limits. Much research has gone into determining the definitive heat stress index, and there is discussion about which is best. For example, Goldman (1988) presents 32 heat stress indices, and there are probably at least double that number used throughout the world. Many indices do not consider all six basic parameters, although all have to take them into conside ration in application. The use of indices will depend upon individual contexts, hence the production of so many. Some indices are inadequate theoretically but can be justified for specific applications based on experience in a particular industry.
Kerslake (1972) notes that “It is perhaps self evident that the way in which the environmental factors should be combined must depend on the properties of the subject exposed to them, but none of the heat stress indices in current use make formal allowance for this”. The recent surge in standardization (e.g., ISO 7933 (1989b) and ISO 7243 (1989a)) has led to pressure to adopt similar indices worldwide. It will be necessary, however, to gain experience with the use of any new index.
Most heat stress indices consider, directly or indirectly, that the main strain on the body is due to sweating. For example, the more sweating required to maintain heat balance and internal body temperature, the greater the strain on the body. For an index of heat stress to represent the human thermal environment and predict heat strain, a mechanism is required to estimate the capacity of a sweating person to lose heat in the hot environment.
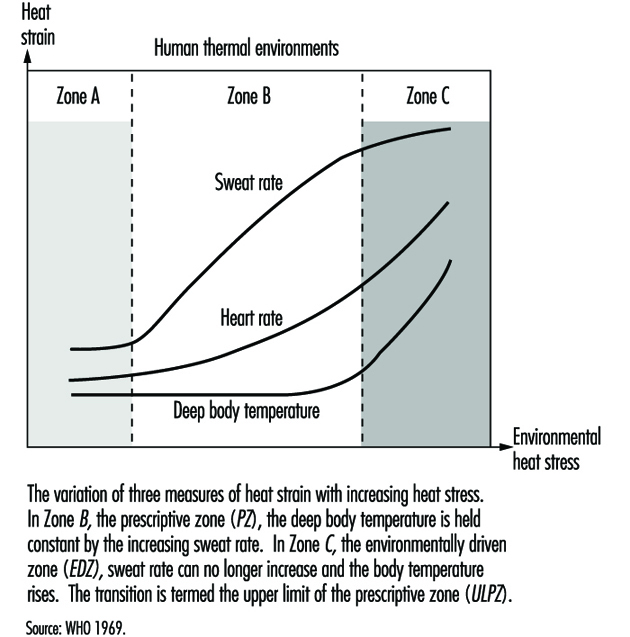
An index related to evaporation of sweat to the environment is useful where persons maintain internal body temperature essentially by sweating. These conditions are generally said to be in the prescriptive zone (WHO 1969). Hence deep body temperature remains relatively constant while heart rate and sweat rate rise with heat stress. At the upper limit of the prescriptive zone (ULPZ), thermoregulation is insufficient to maintain heat balance, and body temperature rises. This is termed the environmentally driven zone (WHO 1969). In this zone heat storage is related to internal body temperature rise and can be used as an index to determine allowable exposure times (e.g., based on a predicted safety limit for “core” temperature of 38 °C; see Figure 1).
Figure 1. Calculated distributions of water in the extracellular compartment (ECW) and intracellular compartment (ICW) before and after 2 h of exercise dehydration at 30°C room temperature.
Heat stress indices can be conveniently categorized as rational, empirical or direct. Rational indices are based upon calculations involving the heat balance equation; empirical indices are based on establishing equations from the physiological responses of human subjects (e.g., sweat loss); and direct indices are based on the measurement (usually temperature) of instruments used to simulate the response of the human body. The most influential and widely used heat stress indices are described below.
Rational indices
The Heat Stress Index (HSI)
The Heat Stress Index is the ratio of evaporation required to maintain heat balance (Ereq) to the maximum evaporation that could be achieved in the environment (Emax), expressed as a percentage (Belding and Hatch 1955). Equations are provided in table 1.
Table 1. Equations used in the calculation of the Heat Stress Index (HSI) and Allowable Exposure Times (AET)
|
|
|
|
Clothed |
Unclothed |
|
(1) Radiation loss (R)
|
|
for |
4.4 |
7.3 |
|
(2) Convection loss (C)
|
|
for |
4.6 |
7.6
|
|
(3) Maximum evaporative loss (
|
|
for |
7.0 |
11.7
|
|
(4) Required evaporation loss (
|
|
|
|
|
|
(5) Heat stress index (HSI) |
|
|
|
|
|
(6) Allowable exposure time (AET) |
|
|
|
|
where: M = metabolic power; ![]() = air temperature;
= air temperature; ![]() = radiant temperature;
= radiant temperature; ![]() = partial vapour pressure; v = air velocity
= partial vapour pressure; v = air velocity
The HSI as an index therefore is related to strain, essentially in terms of body sweating, for values between 0 and 100. At HSI = 100, evaporation required is the maximum that can be achieved, and thus represents the upper limit of the prescriptive zone. For HSI>100, there is body heat storage, and allowable exposure times are calculated based on a 1.8 ºC rise in core temperature (heat storage of 264 kJ). For HSI0 there is mild cold strain—for example, when workers recover from heat strain (see table 2).
Table 2. Interpretation of Heat Stress Index (HSI) values
|
HSI |
Effect of eight hour exposure |
|
–20 |
Mild cold strain (e.g. recovery from heat exposure). |
|
0 |
No thermal strain |
|
10-30 |
Mild to moderate heat strain. Little effect on physical work but possible effect on skilled work |
|
40-60 |
Severe heat strain, involving threat to health unless physically fit. Acclimatization required |
|
70-90 |
Very severe heat strain. Personnel should be selected by medical examination. Ensure adequate water and salt intake |
|
100 |
Maximum strain tolerated daily by fit acclimatized young men |
|
Over 100 |
Exposure time limited by rise in deep body temperature |
An upper limit of 390 W/m2 is assigned to Emax (sweat rate of 1 l/h, taken to be the maximum sweat rate maintained over 8 h). Simple assumptions are made about the effects of clothing (long-sleeved shirt and trousers), and the skin temperature is assumed to be constant at 35ºC.
The Index of Thermal Stress (ITS)
Givoni (1963, 1976) provided the Index of Thermal Stress, which was an improved version of the Heat Stress Index. An important improvement is the recognition that not all sweat evaporates. (See “I. Index of thermal stress” in Case Study: Heat indices.)
Required sweat rate
A further theoretical and practical development of the HSI and ITS was the required sweat rate (SWreq) index (Vogt et al. 1981). This index calculated sweating required for heat balance from an improved heat balance equation but, most importantly, also provided a practical method of interpretation of calculations by comparing what is required with what is physiologically possible and acceptable in humans.
Extensive discussions and laboratory and industrial evaluations (CEC 1988) of this index led to it being accepted as International Standard ISO 7933 (1989b). Differences between observed and predicted responses of workers led to the inclusion of cautionary notes concerning methods of assessing dehydration and evaporative heat transfer through clothing in its adoption as a proposed European Standard (prEN-12515). (See “II. Required sweat rate” in Case Study: Heat indices.)
Interpretation of SWreq
Reference values—in terms of what is acceptable, or what persons can achieve—are used to provide a practical interpretation of calculated values (see table 3).
Table 3. Reference values for criteria of thermal stress and strain (ISO 7933, 1989b)
|
Criteria |
Non-acclimatized subjects |
Acclimatized subjects |
|||
|
Warning |
Danger |
Warning |
Danger |
||
|
Maximum skin wettedness |
|||||
|
wmax |
0.85 |
0.85 |
1.0 |
1.0 |
|
|
Maximum sweat rate |
|||||
|
Rest (M 65 Wm–2 ) |
SWmax Wm–2 gh–1 |
100 |
150 |
200 |
300 |
|
260 |
390 |
520 |
780 |
||
|
Work (M≥65 Wm–2 ) |
SWmax Wm–2 gh–1 |
200 |
250 |
300 |
400 |
|
520 |
650 |
780 |
1,040 |
||
|
Maximum heat storage |
|||||
|
Qmax |
Whm–2 |
50 |
60 |
50 |
60 |
|
Maximum water loss |
|||||
|
Dmax |
Whm–2 g |
1,000 |
1,250 |
1,500 |
2,000 |
|
2,600 |
3,250 |
3,900 |
5,200 |
||
First, a prediction of skin wettedness (Wp), evaporation rate (Ep) and sweat rate (SWp) are made. Essentially, if what is calculated as required can be achieved, then these are predicted values (e.g., SWp = SWreq). If they cannot be achieved, the maximum values can be taken (e.g., SWp=SWmax). More detail is given in a decision flow chart (see figure 2).
Figure 2. Decision flow chart for ![]() (required sweat rate).
(required sweat rate).
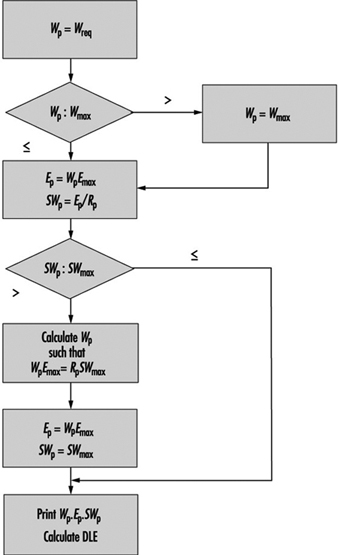
If required sweat rate can be achieved by persons and it will not cause unacceptable water loss, then there is no limit due to heat exposure over an 8-hour shift. If not, the duration-limited exposures (DLE) are calculated from the following:
When Ep = Ereq and SWp = Dmax/8, then DLE = 480 mins and SWreq can be used as a heat stress index. If the above are not satisfied, then:
DLE1 = 60Qmax/( Ereq –Ep)
DLE2 = 60Dmax/SWp
DLE is the lower of DLE1 and DLE2. Fuller details are given in ISO 7933 (1989b).
Other rational indices
The SWreq index and ISO 7933 (1989) provide the most sophisticated rational method based on the heat balance equation, and they were major advances. More developments with this approach can be made; however, an alternative approach is to use a thermal model. Essentially, the New Effective Temperature (ET*) and Standard Effective Temperature (SET) provide indices based on the two-node model of human thermoregulation (Nishi and Gagge 1977). Givoni and Goldman (1972, 1973) also provide empirical prediction models for the assessment of heat stress.
Empirical indices
Effective temperature andcorrected effective temperature
The Effective Temperature index (Houghton and Yaglou 1923) was originally established to provide a method for determining the relative effects of air temperature and humidity on comfort. Three subjects judged which of two climatic chambers was warmer by walking between the two. Using different combinations of air temperature and humidity (and later other parameters), lines of equal comfort were determined. Immediate impressions were made so the transient response was recorded. This had the effect of over-emphasizing the effect of humidity at low temperatures and underestimating it at high temperatures (when compared with steady-state responses). Although originally a comfort index, the use of the black globe temperature to replace dry bulb temperature in the ET nomograms provided the Corrected Effective Temperature (CET) (Bedford 1940). Research reported by Macpherson (1960) suggested that the CET predicted physiological effects of increasing mean radiant temperature. ET and CET are now rarely used as comfort indices but have been used as heat stress indices. Bedford (1940) proposed CET as an index of warmth, with upper limits of 34ºC for “reasonable efficiency” and 38.6ºC for tolerance. Further investigation, however, showed that ET had serious disadvantages for use as a heat stress index, which led to the Predicted Four Hour Sweat Rate (P4SR) index.
Predicted Four Hour Sweat Rate
The Predicted Four Hour Sweat Rate (P4SR) index was established in London by McArdle et al. (1947) and evaluated in Singapore in 7 years of work summarized by Macpherson (1960). It is the amount of sweat secreted by fit, acclimatized young men exposed to the environment for 4 hours while loading guns with ammunition during a naval engagement. The single number (index value) which summarizes the effects of the six basic parameters is an amount of sweat from the specific population, but it should be used as an index value and not as an indication of an amount of sweat in an individual group of interest.
It was acknowledged that outside of the prescriptive zone (e.g., P4SR>5 l) sweat rate was not a good indicator of strain. The P4SR nomograms (figure 3) were adjusted to attempt to account for this. The P4SR appears to have been useful under the conditions for which it was derived; however, the effects of clothing are over-simplified and it is most useful as a heat storage index. McArdle et al. (1947) proposed a P4SR of 4.5 l for a limit where no incapacitation of any fit, acclimatized young men occurred.
Figure 3. Nomogram for the prediction of the "predicted 4-hour sweat rate" (P4SR).

Heart rate prediction as an index
Fuller and Brouha (1966) proposed a simple index based on the prediction of heart rate (HR) in beats per minute. The relationship as originally formulated with metabolic rate in BTU/h and partial vapour pressure in mmHg provided a simple prediction of heart rate from (T + p), hence the T + p index.
Givoni and Goldman (1973) also provide equations for changing heart rate with time and also corrections for degree of acclimatization of subjects, which are given in Case Study" Heat Indices under “IV. Heart rate”.
A method of work and recovery heart rate is described by NIOSH (1986) (from Brouha 1960 and Fuller and Smith 1980, 1981). Body temperature and pulse rates are measured during recovery following a work cycle or at specified times during the working day. At the end of a work cycle the worker sits on a stool, oral temperature is taken and the following three pulse rates are recorded:
P1—pulse rate counted from 30 seconds to 1 minute
P2—pulse rate counted from 1.5 to 2 minutes
P3—pulse rate counted from 2.5 to 3 minutes
The ultimate criterion in terms of heat strain is an oral temperature of 37.5 ºC.
If P3≤90 bpm and P3–P1 = 10 bpm, this indicates work level is high but there is little increase in body temperature. If P3>90 bpm and P3–P110 bpm, the stress (heat + work) is too high and action is needed to redesign work.
Vogt et al. (1981) and ISO 9886 (1992) provide a model (table 4) using heart rate for assessing thermal environments:
Table 4. Model using heart rate to assess heat stress
|
Total heart rate |
Activity level |
|
HR0 |
Rest (thermal neutrality) |
|
HR0 + HRM |
Work |
|
HR0 + HRS |
Static exertion |
|
HR0 + HRt |
Thermal strain |
|
HR0 + HRN |
Emotion (psychological) |
|
HR0 + HRe |
Residual |
Based on Vogt et al. (1981) and ISO 9886 (1992).
The component of thermal strain (possible heat stress index) can be calculated from:
HRt = HRr–HR0
where HRr is heart rate after recovery and HR0 is the resting heart rate in a thermally neutral environment.
Direct Heat Stress Indices
The Wet Bulb Globe Temperature index
The Wet Bulb Globe Temperature (WBGT) index is by far the most widely used throughout the world. It was developed in a US Navy investigation into heat casualties during training (Yaglou and Minard 1957) as an approximation to the more cumbersome Corrected Effective Temperature (CET), modified to account for the solar absorptivity of green military clothing.
WBGT limit values were used to indicate when military recruits could train. It was found that heat casualties and time lost due to cessation of training in the heat were both reduced by using the WBGT index instead of air temperature alone. The WBGT index was adopted by NIOSH (1972), ACGIH (1990) and ISO 7243 (1989a) and is still proposed today. ISO 7243 (1989a), based on the WBGT index, provides a method easily used in a hot environment to provide a “fast” diagnosis. The specification of the measuring instruments is provided in the standard, as are WBGT limit values for acclimatized or non- acclimatized persons (see table 5). For example, for a resting acclimatized person in 0.6 clo, the limit value is 33ºC WBGT. The limits provided in ISO 7243 (1989a) and NIOSH 1972 are almost identical. Calculation of the WBGT index is given in section V of the accompanying Case Study: Heat Indices.
Table 5. WBGT reference values from ISO 7243 (1989a)
|
Metabolic rate M (Wm–2 ) |
Reference value of WBGT |
|||
|
Person acclimatized to |
Person not acclimatized to |
|||
|
0. Resting M≤65 |
33 |
32 |
||
|
1. 65M≤130 |
30 |
29 |
||
|
2. 130M≤200 |
28 |
26 |
||
|
No sensible air movement |
Sensible air movement |
No sensible air movement |
Sensible air movement |
|
|
3. 200M260 |
25 |
26 |
22 |
23 |
|
4. M>260 |
23 |
25 |
18 |
20 |
Note: The values given have been established allowing for a maximum rectal temperature of 38°C for the persons concerned.
The simplicity of the index and its use by influential bodies has led to its widespread acceptance. Like all direct indices it has limitations when used to simulate human response, and should be used with caution in practical applications. It is possible to buy portable instruments which determine the WBGT index (e.g., Olesen 1985).
Physiological heat exposure limit (PHEL)
Dasler (1974, 1977) provides WBGT limit values based on a prediction of exceeding any two physiological limits (from experimental data) of impermissible strain. The limits are given by:
PHEL=(17.25×10⁸–12.97M×106+18.61M2 ×103)×WBGT–5.36
This index therefore uses the WBGT direct index in the environmentally driven zone (see Figure 4), where heat storage can occur.
Wet globe temperature (WGT) index
The temperature of a wet black globe of appropriate size can be used as an index of heat stress. The principle is that it is affected by both dry and evaporative heat transfer, as is a sweating man, and the temperature can then be used, with experience, as a heat stress index. Olesen (1985) describes WGT as the temperature of a 2.5 inch (63.5 mm) diameter black globe covered with a damp black cloth. The temperature is read when equilibrium is reached after about 10 to 15 minutes of exposure. NIOSH (1986) describe the Botsball (Botsford 1971) as the simplest and most easily read instrument. It is a 3-inch (76.2 mm) copper sphere covered by a black cloth kept at 100% wettedness from a self-feeding water reservoir. The sensing element of a thermometer is located at the centre of the sphere, and the temperature is read on a (colour coded) dial.
A simple equation relating WGT to WBGT is:
WBGT = WGT + 2 ºC
for conditions of moderate radiant heat and humidity (NIOSH 1986), but of course this relationship cannot hold over a wide range of conditions.
The Oxford Index
Lind (1957) proposed a simple, direct index used for storage- limited heat exposure and based on a weighted summation of aspirated wet bulb temperature (Twb) and dry bulb temperature (Tdb):
WD = 0.85 Twb + 0.15 Tdb
Allowable exposure times for mine rescue teams were based on this index. It is widely applicable but is not appropriate where there is significant thermal radiation.
Working Practices for Hot Environments
NIOSH (1986) provides a comprehensive description of working practices for hot environments, including preventive medical practices. A proposal for medical supervision of individuals exposed to hot or cold environments is provided in ISO CD 12894 (1993). It should always be remembered that it is a basic human right, which was affirmed by the 1985 Declaration of Helsinki, that, when possible, persons can withdraw from any extreme environment without need of explanation. Where exposure does take place, defined working practices will greatly improve safety.
It is a reasonable principle in environmental ergonomics and in industrial hygiene that, where possible, the environmental stressor should be reduced at the source. NIOSH (1986) divides control methods into five types. These are presented in table 6.
Table 6. Working practices for hot environments
|
A. Engineering controls |
Example |
|
1. Reduce heat source |
Move away from workers or reduce temperature. Not always practicable. |
|
2. Convective heat control |
Modify air temperature and air movements. Spot coolers may be useful. |
|
3. Radiant heat control |
Reduce surface temperatures or place reflective shield between radiant source and workers. Change emissivity of surface. Use doors that open only when access required. |
|
4. Evaporative heat control |
Increase air movement, decrease water vapour pressure. Use fans or air conditioning. Wet clothing and blow air across person. |
|
B. Work and hygiene practices |
Example |
|
1. Limiting exposure time and/or |
Perform jobs at cooler times of day and year. Provide cool areas for rest and recovery. Extra personnel, worker freedom to interrupt work, increase water intake. |
|
2. Reduce metabolic heat load |
Mechanization. Redesign job. Reduce work time. Increase workforce. |
|
3. Enhance tolerance time |
Heat acclimatization program. Keep workers physically fit. Ensure water loss is replaced and maintain electrolyte balance if necessary. |
|
4. Health and safety training |
Supervisors trained in recognizing signs of heat illness and in first aid. Basic instruction to all personnel on personal precautions, use of protective equipment and effects of non-occupational factors (e.g. alcohol). Use of a “buddy” system. Contingency plans for treatment should be in place. |
|
5. Screening for heat intolerance |
History of previous heat illness. Physically unfit. |
|
C. Heat alert program |
Example |
|
1. In spring establish heat alert |
Arrange training course. Memos to supervisors to make checks of drinking fountains, etc. Check facilities, practices, readiness, etc. |
|
2. Declare heat alert in predicted |
Postpone non-urgent tasks. Increase workers, increase rest. Remind workers to drink. Improve working practices. |
|
D. Auxiliary body cooling and protective clothing |
|
|
Use if it is not possible to modify worker, work or environment and heat stress is still beyond limits. Individuals should be fully heat acclimatized and well trained in use and practice of wearing the protective clothing. Examples are water-cooled garments, air-cooled garments, ice-packet vests and wetted overgarments. |
|
|
E. Performance degradation |
|
|
It must be remembered that wearing protective clothing that is providing protection from toxic agents will increase heat stress. All clothing will interfere with activities and may reduce performance (e.g. reducing the ability to receive sensory information hence impairing hearing and vision for example). |
|
Source: NIOSH 1986.
There has been a great deal of military research into so-called NBC (nuclear, biological, chemical) protective clothing. In hot environments it is not possible to remove the clothing, and working practices are very important. A similar problem occurs for workers in nuclear power stations. Methods of cooling workers quickly so that they are able to perform again include sponging the outer surface of the clothing with water and blowing dry air over it. Other techniques include active cooling devices and methods for cooling local areas of the body. The transfer of military clothing technology to industrial situations is a new innovation, but much is known, and appropriate working practices can greatly reduce risk.
Table 7. Equations used in the calculation of the index and assessment method of ISO 7933 (1989b)
![]()
![]()
![]()
![]()
![]()
![]()
![]()
![]()
![]() for natural convection
for natural convection
![]()
![]()
![]()
![]()

![]()
![]()
![]()
![]()

![]()
or ![]() , for an approximation or when values are beyond limits for which the equation was derived.
, for an approximation or when values are beyond limits for which the equation was derived.
____________________________________________________________________________________
Table 8. Description of terms used in ISO 7933 (1989b)
|
Symbol |
Term |
Units |
|
|
fraction of skin surface involved in heat exchange by radiation |
ND |
|
C |
heat exchange on the skin by convection |
Wm−2 |
|
|
respiratory heat loss by convection |
Wm−2 |
|
E |
heat flow by evaporation at skin surface |
Wm−2 |
|
|
maximum evaporative rate which can be achieved with the skin completely wet |
Wm−2 |
|
|
required evaporation for thermal equilibrium |
Wm−2 |
|
|
respiratory heat loss by evaporation |
Wm−2 |
|
|
skin emissivity (0.97) |
ND |
|
|
reduction factor for sensible heat exchange due to clothing |
ND |
|
|
reduction factor for latent heat exchange |
ND |
|
|
ratio of the subject’s clothed to unclothed surface area |
ND |
|
|
convective heat transfer coefficient |
|
|
|
evaporative heat transfer coefficient |
|
|
|
radiative heat transfer coefficient |
|
|
|
basic dry thermal insulation of clothing |
|
|
K |
heat exchange on the skin by conduction |
Wm−2 |
|
M |
metabolic power |
Wm−2 |
|
|
partial vapour pressure |
kPa |
|
|
saturated vapour pressure at skin temperature |
kPa |
|
R |
heat exchange on the skin by radiation |
Wm−2 |
|
|
total evaporative resistance of limiting layer of air and clothing |
|
|
|
evaporative efficiency at required sweat rate |
ND |
|
|
required sweat rate for thermal equilibrium |
Wm−2 |
|
|
Stefan-Boltzman constant, |
|
|
|
air temperature |
|
|
|
mean radiant temperature |
|
|
|
mean skin temperature |
|
|
|
air velocity for a stationary subject |
|
|
|
relative air velocity |
|
|
W |
mechanical power |
Wm−2 |
|
|
skin wettedness |
ND |
|
|
skin wettedness required |
ND |
ND = non-dimensional.
Working Practices for Hot Environments
NIOSH (1986) provides a comprehensive description of working practices for hot environments, including preventive medical practices. A proposal for medical supervision of individuals exposed to hot or cold environments is provided in ISO CD 12894 (1993). It should always be remembered that it is a basic human right, which was affirmed by the 1985Declaration of Helsinki, that, when possible, persons can withdraw from any extreme environment without need of explanation. Where exposure does take place, defined working practices will greatly improve safety.
It is a reasonable principle in environmental ergonomics and in industrial hygiene that, where possible, the environmental stressor should be reduced at the source. NIOSH (1986) divides control methods into five types. These are presented in table 7.There has been a great deal of military research into so-called NBC (nuclear, biological, chemical) protective clothing. In hot environments it is not possible to remove the clothing, and working practices are very important. A similar problem occurs for workers in nuclear power stations. Methods of cooling workers quickly so that they are able to perform again include sponging the outer surface of the clothing with water and blowing dry air over it. Other techniques include active cooling devices and methods for cooling local areas of the body. The transfer of military clothing technology to industrial situations is a new innovation, but much is known, and appropriate working practices can greatly reduce risk.
Assessment of a Hot Environment Using ISO Standards
The following hypothetical example demonstrates how ISO standards can be used in the assessment of hot environments (Parsons 1993):
Workers in a steel mill perform work in four phases. They don clothing and perform light work for 1 hour in a hot radiant environment. They rest for 1 hour, then perform the same light work for an hour shielded from the radiant heat. They then perform work involving a moderate level of physical activity in a hot radiant environment for 30 minutes.
ISO 7243 provides a simple method for monitoring the environment using the WBGT index. If the calculated WBGT levels are less than the WBGT reference values given in the standard, then no further action is required. If the levels exceed the reference values (table 6) then the strain on the workers must be reduced. This can be achieved by engineering controls and working practices. A complementary or alternative action is to conduct an analytical assessment according to ISO 7933.
The WBGT values for the work are presented in table 9 and were measured according to the specifications given in ISO 7243 and ISO 7726. The environmental and personal factors relating to the four phases of the work are presented in table 10.
Table 9. WBGT values (°C) for four work phases
|
Work phase (minutes) |
WBGT = WBGTank + 2 WBGTabd + WBGThd |
WBGT reference |
|
0–60 |
25 |
30 |
|
60–90 |
23 |
33 |
|
90–150 |
23 |
30 |
|
150–180 |
30 |
28 |
Table 10. Basic data for the analytical assessment using ISO 7933
|
Work phase (minutes) |
ta (°C) |
tr (°C) |
Pa (Kpa) |
v (ms–1 ) |
clo (clo) |
Act (Wm–2 ) |
|
0–60 |
30 |
50 |
3 |
0.15 |
0.6 |
100 |
|
60–90 |
30 |
30 |
3 |
0.05 |
0.6 |
58 |
|
90–150 |
30 |
30 |
3 |
0.20 |
0.6 |
100 |
|
150–180 |
30 |
60 |
3 |
0.30 |
1.0 |
150 |
It can be seen that for part of the work the WBGT values exceed those of the reference values. It is concluded that a more detailed analysis is required.
The analytical assessment method presented in ISO 7933 was performed using the data presented in table 10 and the computer program listed in the annex of the standard. The results for acclimatized workers in terms of alarm level are presented in table 11.
Table 11. Analytical assessment using ISO 7933
|
Work phase |
Predicted values |
Duration |
Reason for |
||
|
tsk (°C) |
W (ND) |
SW (gh–1 ) |
|||
|
0–60 |
35.5 |
0.93 |
553 |
423 |
Water loss |
|
60–90 |
34.6 |
0.30 |
83 |
480 |
No limit |
|
90–150 |
34.6 |
0.57 |
213 |
480 |
No limit |
|
150–180 |
35.7 |
1.00 |
566 |
45 |
Body temperature |
|
Overall |
— |
0.82 |
382 |
480 |
No limit |
An overall assessment therefore predicts that unacclimatized workers suitable for the work could carry out an 8-hour shift without undergoing unacceptable (thermal) physiological strain. If greater accuracy is required, or individual workers are to be assessed, then ISO 8996 and ISO 9920 will provide detailed information concerning metabolic heat production and clothing insulation. ISO 9886 describes methods for measuring physiological strain on workers and can be used to design and assess environments for specific workforces. Mean skin temperature, internal body temperature, heart rate and mass loss will be of interest in this example. ISO CD 12894 provides guidance on medical supervision of an investigation.