- You are here:
-
Home

- Part IV. Tools and Approaches

Children categories

27. Biological Monitoring (6)

27. Biological Monitoring
Chapter Editor: Robert Lauwerys
Table of Contents
Tables and Figures
General Principles
Vito Foà and Lorenzo Alessio
Quality Assurance
D. Gompertz
Metals and Organometallic Compounds
P. Hoet and Robert Lauwerys
Organic Solvents
Masayuki Ikeda
Genotoxic Chemicals
Marja Sorsa
Pesticides
Marco Maroni and Adalberto Ferioli
Tables
Click a link below to view table in article context.
1. ACGIH, DFG & other limit values for metals
2. Examples of chemicals & biological monitoring
3. Biological monitoring for organic solvents
4. Genotoxicity of chemicals evaluated by IARC
5. Biomarkers & some cell/tissue samples & genotoxicity
6. Human carcinogens, occupational exposure & cytogenetic end points
8. Exposure from production & use of pesticides
9. Acute OP toxicity at different levels of ACHE inhibition
10. Variations of ACHE & PCHE & selected health conditions
11. Cholinesterase activities of unexposed healthy people
12. Urinary alkyl phosphates & OP pesticides
13. Urinary alkyl phosphates measurements & OP
14. Urinary carbamate metabolites
15. Urinary dithiocarbamate metabolites
16. Proposed indices for biological monitoring of pesticides
17. Recommended biological limit values (as of 1996)
Figures
Point to a thumbnail to see figure caption, click to see figure in article context.
|
|


28. Epidemiology and Statistics (12)
28. Epidemiology and Statistics
Chapter Editors: Franco Merletti, Colin L. Soskolne and Paolo Vineis
Table of Contents
Tables and Figures
Epidemiological Method Applied to Occupational Health and Safety
Franco Merletti, Colin L. Soskolne and Paolo Vineis
Exposure Assessment
M. Gerald Ott
Summary Worklife Exposure Measures
Colin L. Soskolne
Measuring Effects of Exposures
Shelia Hoar Zahm
Case Study: Measures
Franco Merletti, Colin L. Soskolne and Paola Vineis
Options in Study Design
Sven Hernberg
Validity Issues in Study Design
Annie J. Sasco
Impact of Random Measurement Error
Paolo Vineis and Colin L. Soskolne
Statistical Methods
Annibale Biggeri and Mario Braga
Causality Assessment and Ethics in Epidemiological Research
Paolo Vineis
Case Studies Illustrating Methodological Issues in the Surveillance of Occupational Diseases
Jung-Der Wang
Questionnaires in Epidemiological Research
Steven D. Stellman and Colin L. Soskolne
Asbestos Historical Perspective
Lawrence Garfinkel
Tables
Click a link below to view table in article context.
1. Five selected summary measures of worklife exposure
2. Measures of disease occurrence
3. Measures of association for a cohort study
4. Measures of association for case-control studies
5. General frequency table layout for cohort data
6. Sample layout of case-control data
7. Layout case-control data - one control per case
8. Hypothetical cohort of 1950 individuals to T2
9. Indices of central tendency & dispersion
10. A binomial experiment & probabilities
11. Possible outcomes of a binomial experiment
12. Binomial distribution, 15 successes/30 trials
13. Binomial distribution, p = 0.25; 30 trials
14. Type II error & power; x = 12, n = 30, a = 0.05
15. Type II error & power; x = 12, n = 40, a = 0.05
16. 632 workers exposed to asbestos 20 years or longer
17. O/E number of deaths among 632 asbestos workers
Figures
Point to a thumbnail to see figure caption, click to see the figure in article context.
|
|


29. Ergonomics (27)
29. Ergonomics
Chapter Editors: Wolfgang Laurig and Joachim Vedder
Table of Contents
Tables and Figures
Overview
Wolfgang Laurig and Joachim Vedder
Goals, Principles and Methods
The Nature and Aims of Ergonomics
William T. Singleton
Analysis of Activities, Tasks and Work Systems
Véronique De Keyser
Ergonomics and Standardization
Friedhelm Nachreiner
Checklists
Pranab Kumar Nag
Physical and Physiological Aspects
Anthropometry
Melchiorre Masali
Muscular Work
Juhani Smolander and Veikko Louhevaara
Postures at Work
Ilkka Kuorinka
Biomechanics
Frank Darby
General Fatigue
Étienne Grandjean
Fatigue and Recovery
Rolf Helbig and Walter Rohmert
Psychological Aspects
Mental Workload
Winfried Hacker
Vigilance
Herbert Heuer
Mental Fatigue
Peter Richter
Organizational Aspects of Work
Work Organization
Eberhard Ulich and Gudela Grote
Sleep Deprivation
Kazutaka Kogi
Work Systems Design
Workstations
Roland Kadefors
Tools
T.M. Fraser
Controls, Indicators and Panels
Karl H. E. Kroemer
Information Processing and Design
Andries F. Sanders
Designing for Everyone
Designing for Specific Groups
Joke H. Grady-van den Nieuwboer
Case Study: The International Classification of Functional Limitation in People
Cultural Differences
Houshang Shahnavaz
Elderly Workers
Antoine Laville and Serge Volkoff
Workers with Special Needs
Joke H. Grady-van den Nieuwboer
Diversity and Importance of Ergonomics--Two Examples
System Design in Diamond Manufacturing
Issachar Gilad
Disregarding Ergonomic Design Principles: Chernobyl
Vladimir M. Munipov
Tables
Click a link below to view table in article context.
1. Basic anthropometric core list
2. Fatigue & recovery dependent on activity levels
3. Rules of combination effects of two stress factors on strain
4. Differenting among several negative consequences of mental strain
5. Work-oriented principles for production structuring
6. Participation in organizational context
7. User participation in the technology process
8. Irregular working hours & sleep deprivation
9. Aspects of advance, anchor & retard sleeps
10. Control movements & expected effects
11. Control-effect relations of common hand controls
12. Rules for arrangement of controls
Figures
Point to a thumbnail to see figure caption, click to see the figure in the article context.


30. Occupational Hygiene (6)
30. Occupational Hygiene
Chapter Editor: Robert F. Herrick
Table of Contents
Tables and Figures
Goals, Definitions and General Information
Berenice I. Ferrari Goelzer
Recognition of Hazards
Linnéa Lillienberg
Evaluation of the Work Environment
Lori A. Todd
Occupational Hygiene: Control of Exposures Through Intervention
James Stewart
The Biological Basis for Exposure Assessment
Dick Heederik
Occupational Exposure Limits
Dennis J. Paustenbach
Tables
1. Hazards of chemical; biological & physical agents
2. Occupational exposure limits (OELs) - various countries
Figures


31. Personal Protection (7)
31. Personal Protection
Chapter Editor: Robert F. Herrick
Table of Contents
Tables and Figures
Overview and Philosophy of Personal Protection
Robert F. Herrick
Eye and Face Protectors
Kikuzi Kimura
Foot and Leg Protection
Toyohiko Miura
Head Protection
Isabelle Balty and Alain Mayer
Hearing Protection
John R. Franks and Elliott H. Berger
Protective Clothing
S. Zack Mansdorf
Respiratory Protection
Thomas J. Nelson
Tables
Click a link below to view table in article context.
1. Transmittance requirements (ISO 4850-1979)
2. Scales of protection - gas-welding & braze-welding
3. Scales of protection - oxygen cutting
4. Scales of protection - plasma arc cutting
5. Scales of protection - electric arc welding or gouging
6. Scales of protection - plasma direct arc welding
7. Safety helmet: ISO Standard 3873-1977
8. Noise Reduction Rating of a hearing protector
9. Computing the A-weighted noise reduction
10. Examples of dermal hazard categories
11. Physical, chemical & biological performance requirements
12. Material hazards associated with particular activities
13. Assigned protection factors from ANSI Z88 2 (1992)
Figures
Point to a thumbnail to see figure caption, click to see figure in article context.


32. Record Systems and Surveillance (9)
32. Record Systems and Surveillance
Chapter Editor: Steven D. Stellman
Table of Contents
Tables and Figures
Occupational Disease Surveillance and Reporting Systems
Steven B. Markowitz
Occupational Hazard Surveillance
David H. Wegman and Steven D. Stellman
Surveillance in Developing Countries
David Koh and Kee-Seng Chia
Development and Application of an Occupational Injury and Illness Classification System
Elyce Biddle
Risk Analysis of Nonfatal Workplace Injuries and Illnesses
John W. Ruser
Case Study: Worker Protection and Statistics on Accidents and Occupational Diseases - HVBG, Germany
Martin Butz and Burkhard Hoffmann
Case Study: Wismut - A Uranium Exposure Revisited
Heinz Otten and Horst Schulz
Measurement Strategies and Techniques for Occupational Exposure Assessment in Epidemiology
Frank Bochmann and Helmut Blome
Case Study: Occupational Health Surveys in China
Tables
Click a link below to view the table in article context.
1. Angiosarcoma of the liver - world register
2. Occupational illness, US, 1986 versus 1992
3. US Deaths from pneumoconiosis & pleural mesothelioma
4. Sample list of notifiable occupational diseases
5. Illness & injury reporting code structure, US
6. Nonfatal occupational injuries & illnesses, US 1993
7. Risk of occupational injuries & illnesses
8. Relative risk for repetitive motion conditions
9. Workplace accidents, Germany, 1981-93
10. Grinders in metalworking accidents, Germany, 1984-93
11. Occupational disease, Germany, 1980-93
12. Infectious diseases, Germany, 1980-93
13. Radiation exposure in the Wismut mines
14. Occupational diseases in Wismut uranium mines 1952-90
Figures
Point to a thumbnail to see figure caption, click to see the figure in article context.


33. Toxicology (21)
33. Toxicology
Chapter Editor: Ellen K. Silbergeld
Table of Contents
Tables and Figures
Introduction
Ellen K. Silbergeld, Chapter Editor
General Principles of Toxicology
Definitions and Concepts
Bo Holmberg, Johan Hogberg and Gunnar Johanson
Toxicokinetics
Dušan Djuríc
Target Organ And Critical Effects
Marek Jakubowski
Effects Of Age, Sex And Other Factors
Spomenka Telišman
Genetic Determinants Of Toxic Response
Daniel W. Nebert and Ross A. McKinnon
Mechanisms of Toxicity
Introduction And Concepts
Philip G. Watanabe
Cellular Injury And Cellular Death
Benjamin F. Trump and Irene K. Berezesky
Genetic Toxicology
R. Rita Misra and Michael P. Waalkes
Immunotoxicology
Joseph G. Vos and Henk van Loveren
Target Organ Toxicology
Ellen K. Silbergeld
Toxicology Test Methods
Biomarkers
Philippe Grandjean
Genetic Toxicity Assessment
David M. DeMarini and James Huff
In Vitro Toxicity Testing
Joanne Zurlo
Structure Activity Relationships
Ellen K. Silbergeld
Regulatory Toxicology
Toxicology In Health And Safety Regulation
Ellen K. Silbergeld
Principles Of Hazard Identification - The Japanese Approach
Masayuki Ikeda
The United States Approach to Risk Assessment Of Reproductive Toxicants and Neurotoxic Agents
Ellen K. Silbergeld
Approaches To Hazard Identification - IARC
Harri Vainio and Julian Wilbourn
Appendix - Overall Evaluations of Carcinogenicity to Humans: IARC Monographs Volumes 1-69 (836)
Carcinogen Risk Assessment: Other Approaches
Cees A. van der Heijden
Tables
Click a link below to view table in article context.
- Examples of critical organs & critical effects
- Basic effects of possible multiple interactions of metals
- Haemoglobin adducts in workers exposed to aniline & acetanilide
- Hereditary, cancer-prone disorders & defects in DNA repair
- Examples of chemicals that exhibit genotoxicity in human cells
- Classification of tests for immune markers
- Examples of biomarkers of exposure
- Pros & cons of methods for identifying human cancer risks
- Comparison of in vitro systems for hepatotoxicity studies
- Comparison of SAR & test data: OECD/NTP analyses
- Regulation of chemical substances by laws, Japan
- Test items under the Chemical Substance Control Law, Japan
- Chemical substances & the Chemical Substances Control Law
- Selected major neurotoxicity incidents
- Examples of specialized tests to measure neurotoxicity
- Endpoints in reproductive toxicology
- Comparison of low-dose extrapolations procedures
- Frequently cited models in carcinogen risk characterization
Figures
Point to a thumbnail to see figure caption, click to see figure in article context.
|
|


General Fatigue
This article is adapted from the 3rd edition of the Encyclopaedia of Occupational Health and Safety.
The two concepts of fatigue and rest are familiar to all from personal experience. The word “fatigue” is used to denote very different conditions, all of which cause a reduction in work capacity and resistance. The very varied use of the concept of fatigue has resulted in an almost chaotic confusion and some clarification of current ideas is necessary. For a long time, physiology has distinguished between muscle fatigue and general fatigue. The former is an acute painful phenomenon localized in the muscles: general fatigue is characterized by a sense of diminishing willingness to work. This article is concerned only with general fatigue, which may also be called “psychic fatigue” or “nervous fatigue” and the rest that it necessitates.
General fatigue may be due to quite different causes, the most important of which are shown in figure 1. The effect is as if, during the course of the day, all the various stresses experienced accumulate within the organism, gradually producing a feeling of increasing fatigue. This feeling prompts the decision to stop work; its effect is that of a physiological prelude to sleep.
Figure 1. Diagrammatic presentation of the cumulative effect of the everyday causes of fatigue
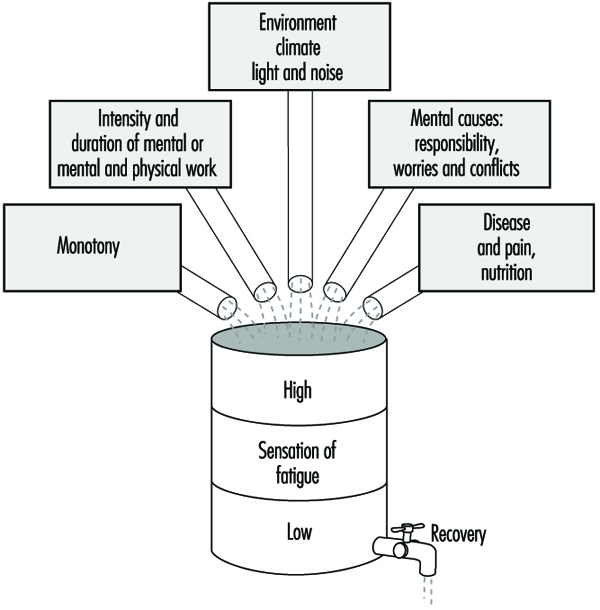
Fatigue is a salutary sensation if one can lie down and rest. However, if one disregards this feeling and forces oneself to continue working, the feeling of fatigue increases until it becomes distressing and finally overwhelming. This daily experience demonstrates clearly the biological significance of fatigue which plays a part in sustaining life, similar to that played by other sensations such as, for example, thirst, hunger, fear, etc.
Rest is represented in figure 1 as the emptying of a barrel. The phenomenon of rest can take place normally if the organism remains undisturbed or if at least one essential part of the body is not subjected to stress. This explains the decisive part played on working days by all work breaks, from the short pause during work to the nightly sleep. The simile of the barrel illustrates how necessary it is for normal living to reach a certain equilibrium between the total load borne by the organism and the sum of the possibilities for rest.
Neurophysiological interpretation of fatigue
The progress of neurophysiology during the last few decades has greatly contributed to a better understanding of the phenomena triggered off by fatigue in the central nervous system.
The physiologist Hess was the first to observe that electrical stimulation of certain of the diencephalic structures, and more especially of certain of the structures of the medial nucleus of the thalamus, gradually produced an inhibiting effect which showed itself in a deterioration in the capacity for reaction and in a tendency to sleep. If the stimulation was continued for a certain time, general relaxation was followed by sleepiness and finally by sleep. It was later proved that starting from these structures, an active inhibition may extend to the cerebral cortex where all conscious phenomena are centered. This is reflected not only in behaviour, but also in the electrical activity of the cerebral cortex. Other experiments have also succeeded in initiating inhibitions from other subcortical regions.
The conclusion which can be drawn from all these studies is that there are structures located in the diencephalon and mesencephalon which represent an effective inhibiting system and which trigger off fatigue with all its accompanying phenomena.
Inhibition and activation
Numerous experiments performed on animals and humans have shown that the general disposition of them both to reaction depends not only on this system of inhibition but essentially also on a system functioning in an antagonistic manner, known as the reticular ascending system of activation. We know from experiments that the reticular formation contains structures that control the degree of wakefulness, and consequently the general dispositions to a reaction. Nervous links exist between these structures and the cerebral cortex where the activating influences are exerted on the consciousness. Moreover, the activating system receives stimulation from the sensory organs. Other nervous connections transmit impulses from the cerebral cortex—the area of perception and thought—to the activation system. On the basis of these neurophysiological concepts, it can be established that external stimuli, as well as influences originating in the areas of consciousness, may, in passing through the activating system, stimulate a disposition to a reaction.
In addition, many other investigations make it possible to conclude that stimulation of the activating system frequently spreads also from the vegetative centers, and cause the organism to orient towards the expenditure of energy, towards work, struggle, flight, etc. (ergotropic conversion of the internal organs). Conversely, it appears that stimulation of the inhibiting system within the sphere of the vegetative nervous system causes the organism to tend towards rest, reconstitution of its reserves of energy, phenomena of assimilation (trophotropic conversion).
By synthesis of all these neurophysiological findings, the following conception of fatigue can be established: the state and feeling of fatigue are conditioned by the functional reaction of the consciousness in the cerebral cortex, which is, in turn, governed by two mutually antagonistic systems—the inhibiting system and the activating system. Thus, the disposition of humans to work depends at each moment on the degree of activation of the two systems: if the inhibiting system is dominant, the organism will be in a state of fatigue; when the activating system is dominant, it will exhibit an increased disposition to work.
This psychophysiological conception of fatigue makes it possible to understand certain of its symptoms which are sometimes difficult to explain. Thus, for example, a feeling of fatigue may disappear suddenly when some unexpected outside event occurs or when emotional tension develops. It is clear in both these cases that the activating system has been stimulated. Conversely, if the surroundings are monotonous or work seems boring, the functioning of the activating system is diminished and the inhibiting system becomes dominant. This explains why fatigue appears in a monotonous situation without the organism being subjected to any workload.
Figure 2 depicts diagrammatically the notion of the mutually antagonistic systems of inhibition and activation.
Figure 2. Diagrammatic presentation of the control of disposition to work by means of inhibiting and activating systems

Clinical fatigue
It is a matter of common experience that pronounced fatigue occurring day after day will gradually produce a state of chronic fatigue. The feeling of fatigue is then intensified and comes on not only in the evening after work but already during the day, sometimes even before the start of work. A feeling of malaise, frequently of an emotive nature, accompanies this state. The following symptoms are often observed in persons suffering from fatigue: heightened psychic emotivity (antisocial behaviour, incompatibility), tendency to depression (unmotivated anxiety), and lack of energy with loss of initiative. These psychic effects are often accompanied by an unspecific malaise and manifest themselves by psychosomatic symptoms: headaches, vertigo, cardiac and respiratory functional disturbances, loss of appetite, digestive disorders, insomnia, etc.
In view of the tendency towards morbid symptoms that accompany chronic fatigue, it may justly be called clinical fatigue. There is a tendency towards increased absenteeism, and particularly to more absences for short periods. This would appear to be caused both by the need for rest and by increased morbidity. The state of chronic fatigue occurs particularly among persons exposed to psychic conflicts or difficulties. It is sometimes very difficult to distinguish the external and internal causes. In fact, it is almost impossible to distinguish cause and effect in clinical fatigue: a negative attitude towards work, superiors or workplace may just as well be the cause of clinical fatigue as the result.
Research has shown that the switchboard operators and supervisory personnel employed in telecommunications services exhibited a significant increase in physiological symptoms of fatigue after their work (visual reaction time, flicker fusion frequency, dexterity tests). Medical investigations revealed that in these two groups of workers there was a significant increase in neurotic conditions, irritability, difficulty in sleeping and in the chronic feeling of lassitude, by comparison with a similar group of women employed in the technical branches of the postal, telephone and telegraphic services. The accumulation of symptoms was not always due to a negative attitude on the part of the women affected their job or their working conditions.
Preventive Measures
There is no panacea for fatigue but much can be done to alleviate the problem by attention to general working conditions and the physical environment at the workplace. For example much can be achieved by the correct arrangement of hours of work, provision of adequate rest periods and suitable canteens and restrooms; adequate paid holidays should also be given to workers. The ergonomic study of the workplace can also help in the reduction of fatigue by ensuring that seats, tables, and workbenches are of suitable dimensions and that the workflow is correctly organized. In addition, noise control, air-conditioning, heating, ventilation, and lighting may all have a beneficial effect on delaying the onset of fatigue in workers.
Monotony and tension may also be alleviated by controlled use of colour and decoration in the surroundings, intervals of music and sometimes breaks for physical exercises for sedentary workers. Training of workers and in particular of supervisory and management staff also play an important part.
Target Organ Toxicology
The study and characterization of chemicals and other agents for toxic properties is often undertaken on the basis of specific organs and organ systems. In this chapter, two targets have been selected for in-depth discussion: the immune system and the gene. These examples were chosen to represent a complex target organ system and a molecular target within cells. For more comprehensive discussion of the toxicology of target organs, the reader is referred to standard toxicology texts such as Casarett and Doull, and Hayes. The International Programme on Chemical Safety (IPCS) has also published several criteria documents on target organ toxicology, by organ system.
Target organ toxicology studies are usually undertaken on the basis of information indicating the potential for specific toxic effects of a substance, either from epidemiological data or from general acute or chronic toxicity studies, or on the basis of special concerns to protect certain organ functions, such as reproduction or foetal development. In some cases, specific target organ toxicity tests are expressly mandated by statutory authorities, such as neurotoxicity testing under the US pesticides law (see “The United States approach to risk assessment of reproductive toxicants and neurotoxic agents,” and mutagenicity testing under the Japanese Chemical Substance Control Law (see “Principles of hazard identification: The Japanese approach”).
As discussed in “Target organ and critical effects,” the identification of a critical organ is based upon the detection of the organ or organ system which first responds adversely or to the lowest doses or exposures. This information is then used to design specific toxicology investigations or more defined toxicity tests that are designed to elicit more sensitive indications of intoxication in the target organ. Target organ toxicology studies may also be used to determine mechanisms of action, of use in risk assessment (see “The United States approach to risk assessment of reproductive toxicants and neurotoxic agents”).
Methods of Target Organ Toxicity Studies
Target organs may be studied by exposure of intact organisms and detailed analysis of function and histopathology in the target organ, or by in vitro exposure of cells, tissue slices, or whole organs maintained for short or long term periods in culture (see “Mechanisms of toxicology: Introduction and concepts”). In some cases, tissues from human subjects may also be available for target organ toxicity studies, and these may provide opportunities to validate assumptions of cross-species extrapolation. However, it must be kept in mind that such studies do not provide information on relative toxicokinetics.
In general, target organ toxicity studies share the following common characteristics: detailed histopathological examination of the target organ, including post mortem examination, tissue weight, and examination of fixed tissues; biochemical studies of critical pathways in the target organ, such as important enzyme systems; functional studies of the ability of the organ and cellular constituents to perform expected metabolic and other functions; and analysis of biomarkers of exposure and early effects in target organ cells.
Detailed knowledge of target organ physiology, biochemistry and molecular biology may be incorporated in target organ studies. For instance, because the synthesis and secretion of small-molecular-weight proteins is an important aspect of renal function, nephrotoxicity studies often include special attention to these parameters (IPCS 1991). Because cell-to-cell communication is a fundamental process of nervous system function, target organ studies in neurotoxicity may include detailed neurochemical and biophysical measurements of neurotransmitter synthesis, uptake, storage, release and receptor binding, as well as electrophysiological measurement of changes in membrane potential associated with these events.
A high degree of emphasis is being placed upon the development of in vitro methods for target organ toxicity, to replace or reduce the use of whole animals. Substantial advances in these methods have been achieved for reproductive toxicants (Heindel and Chapin 1993).
In summary, target organ toxicity studies are generally undertaken as a higher order test for determining toxicity. The selection of specific target organs for further evaluation depends upon the results of screening level tests, such as the acute or subchronic tests used by OECD and the European Union; some target organs and organ systems may be a priori candidates for special investigation because of concerns to prevent certain types of adverse health effects.
Validity Issues in Study Design
The Need for Validity
Epidemiology aims at providing an understanding of the disease experience in populations. In particular, it can be used to obtain insight into the occupational causes of ill health. This knowledge comes from studies conducted on groups of people having a disease by comparing them to people without that disease. Another approach is to examine what diseases people who work in certain jobs with particular exposures acquire and to compare these disease patterns to those of people not similarly exposed. These studies provide estimates of risk of disease for specific exposures. For information from such studies to be used for establishing prevention programmes, for the recognition of occupational diseases, and for those workers affected by exposures to be appropriately compensated, these studies must be valid.
Validity can be defined as the ability of a study to reflect the true state of affairs. A valid study is therefore one which measures correctly the association (either positive, negative or absent) between an exposure and a disease. It describes the direction and magnitude of a true risk. Two types of validity are distinguished: internal and external validity. Internal validity is a study’s ability to reflect what really happened among the study subjects; external validity reflects what could occur in the population.
Validity relates to the truthfulness of a measurement. Validity must be distinguished from precision of the measurement, which is a function of the size of the study and the efficiency of the study design.
Internal Validity
A study is said to be internally valid when it is free from biases and therefore truly reflects the association between exposure and disease which exists among the study participants. An observed risk of disease in association with an exposure may indeed result from a real association and therefore be valid, but it may also reflect the influence of biases. A bias will give a distorted image of reality.
Three major types of biases, also called systematic errors, are usually distinguished:
- selection bias
- information or observation bias
- confounding
They will be presented briefly below, using examples from the occupational health setting.
Selection bias
Selection bias will occur when the entry into the study is influenced by knowledge of the exposure status of the potential study participant. This problem is therefore encountered only when the disease has already taken place by the time (before) the person enters the study. Typically, in the epidemiological setting, this will happen in case-control studies or in retrospective cohort studies. This means that a person will be more likely to be considered a case if it is known that he or she has been exposed. Three sets of circumstances may lead to such an event, which will also depend on the severity of the disease.
Self-selection bias
This can occur when people who know they have been exposed to known or believed harmful products in the past and who are convinced their disease is the result of the exposure will consult a physician for symptoms which other people, not so exposed, might have ignored. This is particularly likely to happen for diseases which have few noticeable symptoms. An example may be early pregnancy loss or spontaneous abortion among female nurses handling drugs used for cancer treatment. These women are more aware than most of reproductive physiology and, by being concerned about their ability to have children, may be more likely to recognize or label as a spontaneous abortion what other women would only consider as a delay in the onset of menstruation. Another example from a retrospective cohort study, cited by Rothman (1986), involves a Centers for Disease Control study of leukaemia among troops who had been present during a US atomic test in Nevada. Of the troops present on the test site, 76% were traced and constituted the cohort. Of these, 82% were found by the investigators, but an additional 18% contacted the investigators themselves after hearing publicity about the study. Four cases of leukaemia were present among the 82% traced by CDC and four cases were present among the self-referred 18%. This strongly suggests that the investigators’ ability to identify exposed persons was linked to leukaemia risk.
Diagnostic bias
This will occur when the doctors are more likely to diagnose a given disease once they know to what the patient has been previously exposed. For example, when most paints were lead-based, a symptom of disease of the peripheral nerves called peripheral neuritis with paralysis was also known as painters’ “wrist drop”. Knowing the occupation of the patient made it easier to diagnose the disease even in its early stages, whereas the identification of the causal agent would be much more difficult in research participants not known to be occupationally exposed to lead.
Bias resulting from refusal to participate in a study
When people, either healthy or sick, are asked to participate in a study, several factors play a role in determining whether or not they will agree. Willingness to answer variably lengthy questionnaires, which at times inquire about sensitive issues, and even more so to give blood or other biological samples, may be determined by the degree of self-interest held by the person. Someone who is aware of past potential exposure may be ready to comply with this inquiry in the hope that it will help to find the cause of the disease, whereas someone who considers that they have not been exposed to anything dangerous, or who is not interested in knowing, may decline the invitation to participate in the study. This can lead to a selection of those people who will finally be the study participants as compared to all those who might have been.
Information bias
This is also called observation bias and concerns disease outcome in follow-up studies and exposure assessment in case-control studies.
Differential outcome assessment in prospective follow-up (cohort) studies
Two groups are defined at the start of the study: an exposed group and an unexposed group. Problems of diagnostic bias will arise if the search for cases differs between these two groups. For example, consider a cohort of people exposed to an accidental release of dioxin in a given industry. For the highly exposed group, an active follow-up system is set up with medical examinations and biological monitoring at regular intervals, whereas the rest of the working population receives only routine care. It is highly likely that more disease will be identified in the group under close surveillance, which would lead to a potential over-estimation of risk.
Differential losses in retrospective cohort studies
The reverse mechanism to that described in the preceding paragraph may occur in retrospective cohort studies. In these studies, the usual way of proceeding is to start with the files of all the people who have been employed in a given industry in the past, and to assess disease or mortality subsequent to employment. Unfortunately, in almost all studies files are incomplete, and the fact that a person is missing may be related either to exposure status or to disease status or to both. For example, in a recent study conducted in the chemical industry in workers exposed to aromatic amines, eight tumours were found in a group of 777 workers who had undergone cytological screening for urinary tumours. Altogether, only 34 records were found missing, corresponding to a 4.4% loss from the exposure assessment file, but for bladder cancer cases, exposure data were missing for two cases out of eight, or 25%. This shows that the files of people who became cases were more likely to become lost than the files of other workers. This may occur because of more frequent job changes within the company (which may be linked to exposure effects), resignation, dismissal or mere chance.
Differential assessment of exposure in case-control studies
In case-control studies, the disease has already occurred at the start of the study, and information will be sought on exposures in the past. Bias may result either from the interviewer’s or study participant’s attitude to the investigation. Information is usually collected by trained interviewers who may or may not be aware of the hypothesis underlying the research. For example, in a population-based case-control study of bladder cancer conducted in a highly industrialized region, study staff may well be aware of the fact that certain chemicals, such as aromatic amines, are risk factors for bladder cancer. If they also know who has developed the disease and who has not, they may be likely to conduct more in-depth interviews with the participants who have bladder cancer than with the controls. They may insist on more detailed information of past occupations, searching systematically for exposure to aromatic amines, whereas for controls they may record occupations in a more routine way. The resulting bias is known as exposure suspicion bias.
The participants themselves may also be responsible for such bias. This is called recall bias to distinguish it from interviewer bias. Both have exposure suspicion as the mechanism for the bias. Persons who are sick may suspect an occupational origin to their disease and therefore will try to remember as accurately as possible all the dangerous agents to which they may have been exposed. In the case of handling undefined products, they may be inclined to recall the names of precise chemicals, particularly if a list of suspected products is made available to them. By contrast, controls may be less likely to go through the same thought process.
Confounding
Confounding exists when the association observed between exposure and disease is in part the result of a mixing of the effect of the exposure under study and another factor. Let us say, for example, that we are finding an increased risk of lung cancer among welders. We are tempted to conclude immediately that there is a causal association between exposure to welding fumes and lung cancer. However, we also know that smoking is by far the main risk factor for lung cancer. Therefore, if information is available, we begin checking the smoking status of welders and other study participants. We may find that welders are more likely to smoke than non-welders. In that situation, smoking is known to be associated with lung cancer and, at the same time, in our study smoking is also found to be associated with being a welder. In epidemiological terms, this means that smoking, linked both to lung cancer and to welding, is confounding the association between welding and lung cancer.
Interaction or effect modification
In contrast to all the issues listed above, namely selection, information and confounding, which are biases, interaction is not a bias due to problems in study design or analysis, but reflects reality and its complexity. An example of this phenomenon is the following: exposure to radon is a risk factor for lung cancer, as is smoking. In addition, smoking and radon exposure have different effects on lung cancer risk depending on whether they act together or in isolation. Most of the occupational studies on this topic have been conducted among underground miners and at times have provided conflicting results. Overall, there seem to be arguments in favour of an interaction of smoking and radon exposure in producing lung cancer. This means that lung cancer risk is increased by exposure to radon, even in non-smokers, but that the size of the risk increase from radon is much greater among smokers than among non-smokers. In epidemiological terms, we say that the effect is multiplicative. In contrast to confounding, described above, interaction needs to be carefully analysed and described in the analysis rather than simply controlled, as it reflects what is happening at the biological level and is not merely a consequence of poor study design. Its explanation leads to a more valid interpretation of the findings from a study.
External Validity
This issue can be addressed only after ensuring that internal validity is secured. If we are convinced that the results observed in the study reflect associations which are real, we can ask ourselves whether or not we can extrapolate these results to the larger population from which the study participants themselves were drawn, or even to other populations which are identical or at least very similar. The most common question is whether results obtained for men also apply to women. For years, studies and, in particular, occupational epidemiological investigations have been conducted exclusively among men. Studies among chemists carried out in the 1960s and 1970s in the United States, United Kingdom and Sweden all found increased risks of specific cancers—namely leukaemia, lymphoma and pancreatic cancer. Based on what we knew of the effects of exposure to solvents and some other chemicals, we could already have deduced at the time that laboratory work also entailed carcinogenic risk for women. This in fact was shown to be the case when the first study among women chemists was finally published in the mid-1980s, which found results similar to those among men. It is worth noting that other excess cancers found were tumours of the breast and ovary, traditionally considered as being related only to endogenous factors or reproduction, but for which newly suspected environmental factors such as pesticides may play a role. Much more work needs to be done on occupational determinants of female cancers.
Strategies for a Valid Study
A perfectly valid study can never exist, but it is incumbent upon the researcher to try to avoid, or at least to minimize, as many biases as possible. This can often best be done at the study design stage, but can also be carried out during analysis.
Study design
Selection and information bias can be avoided only through the careful design of an epidemiological study and the scrupulous implementation of all the ensuing day-to-day guidelines, including meticulous attention to quality assurance, for the conduct of the study in field conditions. Confounding may be dealt with either at the design or analysis stage.
Selection
Criteria for considering a participant as a case must be explicitly defined. One cannot, or at least should not, attempt to study ill-defined clinical conditions. A way of minimizing the impact that knowledge of the exposure may have on disease assessment is to include only severe cases which would have been diagnosed irrespective of any information on the history of the patient. In the field of cancer, studies often will be limited to cases with histological proof of the disease to avoid the inclusion of borderline lesions. This also will mean that groups under study are well defined. For example, it is well-known in cancer epidemiology that cancers of different histological types within a given organ may have dissimilar risk factors. If the number of cases is sufficient, it is better to separate adenocarcinoma of the lung from squamous cell carcinoma of the lung. Whatever the final criteria for entry into the study, they should always be clearly defined and described. For example, the exact code of the disease should be indicated using the International Classification of Diseases (ICD) and also, for cancer, the International Classification of Diseases-Oncology (ICD-O).
Efforts should be made once the criteria are specified to maximize participation in the study. The decision to refuse to participate is hardly ever made at random and therefore leads to bias. Studies should first of all be presented to the clinicians who are seeing the patients. Their approval is needed to approach patients, and therefore they will have to be convinced to support the study. One argument that is often persuasive is that the study is in the interest of the public health. However, at this stage it is better not to discuss the exact hypothesis being evaluated in order to avoid unduly influencing the clinicians involved. Physicians should not be asked to take on supplementary duties; it is easier to convince health personnel to lend their support to a study if means are provided by the study investigators to carry out any additional tasks, over and above routine care, necessitated by the study. Interviewers and data abstractors ought to be unaware of the disease status of their patients.
Similar attention should be paid to the information provided to participants. The goal of the study must be described in broad, neutral terms, but must also be convincing and persuasive. It is important that issues of confidentiality and interest for public health be fully understood while avoiding medical jargon. In most settings, use of financial or other incentives is not considered appropriate, although compensation should be provided for any expense a participant may incur. Last, but not least, the general population should be sufficiently scientifically literate to understand the importance of such research. Both the benefits and the risks of participation must be explained to each prospective participant where they need to complete questionnaires and/or to provide biological samples for storage and/or analysis. No coercion should be applied in obtaining prior and fully informed consent. Where studies are exclusively records-based, prior approval of the agencies responsible for ensuring the confidentiality of such records must be secured. In these instances, individual participant consent usually can be waived. Instead, approval of union and government officers will suffice. Epidemiological investigations are not a threat to an individual’s private life, but are a potential aid to improve the health of the population. The approval of an institutional review board (or ethics review committee) will be needed prior to the conduct of a study, and much of what is stated above will be expected by them for their review.
Information
In prospective follow-up studies, means for assessment of the disease or mortality status must be identical for exposed and non-exposed participants. In particular, different sources should not be used, such as only checking in a central mortality register for non-exposed participants and using intensive active surveillance for exposed participants. Similarly, the cause of death must be obtained in strictly comparable ways. This means that if a system is used to gain access to official documents for the unexposed population, which is often the general population, one should never plan to get even more precise information through medical records or interviews on the participants themselves or on their families for the exposed subgroup.
In retrospective cohort studies, efforts should be made to determine how closely the population under study is compared to the population of interest. One should beware of potential differential losses in exposed and non-exposed groups by using various sources concerning the composition of the population. For example, it may be useful to compare payroll lists with union membership lists or other professional listings. Discrepancies must be reconciled and the protocol adopted for the study must be closely followed.
In case-control studies, other options exist to avoid biases. Interviewers, study staff and study participants need not be aware of the precise hypothesis under study. If they do not know the association being tested, they are less likely to try to provide the expected answer. Keeping study personnel in the dark as to the research hypothesis is in fact often very impractical. The interviewer will almost always know the exposures of greatest potential interest as well as who is a case and who is a control. We therefore have to rely on their honesty and also on their training in basic research methodology, which should be a part of their professional background; objectivity is the hallmark at all stages in science.
It is easier not to inform the study participants of the exact object of the research. Good, basic explanations on the need to collect data in order to have a better understanding of health and disease are usually sufficient and will satisfy the needs of ethics review.
Confounding
Confounding is the only bias which can be dealt with either at the study design stage or, provided adequate information is available, at the analysis stage. If, for example, age is considered to be a potential confounder of the association of interest because age is associated with the risk of disease (i.e., cancer becomes more frequent in older age) and also with exposure (conditions of exposure vary with age or with factors related to age such as qualification, job position and duration of employment), several solutions exist. The simplest is to limit the study to a specified age range—for example, enrol only Caucasian men aged 40 to 50. This will provide elements for a simple analysis, but will also have the drawback of limiting the application of the results to a single sex age/racial group. Another solution is matching on age. This means that for each case, a referent of the same age is needed. This is an attractive idea, but one has to keep in mind the possible difficulty of fulfilling this requirement as the number of matching factors increases. In addition, once a factor has been matched on, it becomes impossible to evaluate its role in the occurrence of disease. The last solution is to have sufficient information on potential confounders in the study database in order to check for them in the analysis. This can be done either through a simple stratified analysis, or with more sophisticated tools such as multivariate analysis. However, it should be remembered that analysis will never be able to compensate for a poorly designed or conducted study.
Conclusion
The potential for biases to occur in epidemiological research is long established. This was not too much of a concern when the associations being studied were strong (as is the case for smoking and lung cancer) and therefore some inaccuracy did not cause too severe a problem. However, now that the time has come to evaluate weaker risk factors, the need for better tools becomes paramount. This includes the need for excellent study designs and the possibility of combining the advantages of various traditional designs such as the case-control or cohort studies with more innovative approaches such as case-control studies nested within a cohort. Also, the use of biomarkers may provide the means of obtaining more accurate assessments of current and possibly past exposures, as well as for the early stages of disease.
Fatigue and Recovery
Fatigue and recovery are periodic processes in every living organism. Fatigue can be described as a state which is characterized by a feeling of tiredness combined with a reduction or undesired variation in the performance of the activity (Rohmert 1973).
Not all the functions of the human organism become tired as a result of use. Even when asleep, for example, we breathe and our heart is pumping without pause. Obviously, the basic functions of breathing and heart activity are possible throughout life without fatigue and without pauses for recovery.
On the other hand, we find after fairly prolonged heavy work that there is a reduction in capacity—which we call fatigue. This does not apply to muscular activity alone. The sensory organs or the nerve centres also become tired. It is, however, the aim of every cell to balance out the capacity lost by its activity, a process which we call recovery.
Stress, Strain, Fatigue and Recovery
The concepts of fatigue and recovery at human work is closely related to the ergonomic concepts of stress and strain (Rohmert 1984) (figure 1).
Figure 1. Stress, strain and fatigue
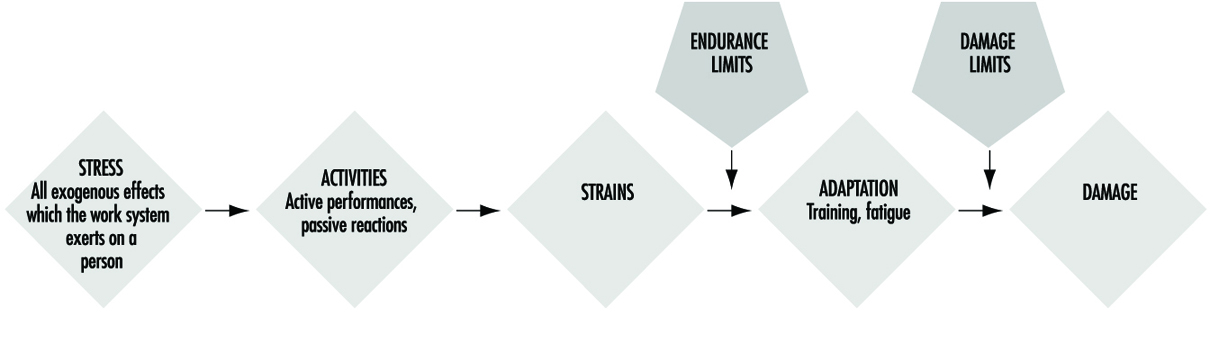
Stress means the sum of all parameters of work in the working system influencing people at work, which are perceived or sensed mainly over the receptor system or which put demands on the effector system. The parameters of stress result from the work task (muscular work, non-muscular work—task-oriented dimensions and factors) and from the physical, chemical and social conditions under which the work has to be done (noise, climate, illumination, vibration, shift work, etc.—situation-oriented dimensions and factors).
The intensity/difficulty, the duration and the composition (i.e., the simultaneous and successive distribution of these specific demands) of the stress factors results in combined stress, which all the exogenous effects of a working system exert on the working person. This combined stress can be actively coped with or passively put up with, specifically depending on the behaviour of the working person. The active case will involve activities directed towards the efficiency of the working system, while the passive case will induce reactions (voluntary or involuntary), which are mainly concerned with minimizing stress. The relation between the stress and activity is decisively influenced by the individual characteristics and needs of the working person. The main factors of influence are those that determine performance and are related to motivation and concentration and those related to disposition, which can be referred to as abilities and skills.
The stresses relevant to behaviour, which are manifest in certain activities, cause individually different strains. The strains can be indicated by the reaction of physiological or biochemical indicators (e.g., raising the heart rate) or it can be perceived. Thus, the strains are susceptible to “psycho-physical scaling”, which estimates the strain as experienced by the working person. In a behavioural approach, the existence of strain can also be derived from an activity analysis. The intensity with which indicators of strain (physiological-biochemical, behaviouristic or psycho-physical) react depends on the intensity, duration, and combination of stress factors as well as on the individual characteristics, abilities, skills, and needs of the working person.
Despite constant stresses the indicators derived from the fields of activity, performance and strain may vary over time (temporal effect). Such temporal variations are to be interpreted as processes of adaptation by the organic systems. The positive effects cause a reduction of strain/improvement of activity or performance (e.g., through training). In the negative case, however, they will result in increased strain/reduced activity or performance (e.g., fatigue, monotony).
The positive effects may come into action if the available abilities and skills are improved in the working process itself, e.g., when the threshold of training stimulation is slightly exceeded. The negative effects are likely to appear if so-called endurance limits (Rohmert 1984) are exceeded in the course of the working process. This fatigue leads to a reduction of physiological and psychological functions, which can be compensated by recovery.
To restore the original performance rest allowances or at least periods with less stress are necessary (Luczak 1993).
When the process of adaptation is carried beyond defined thresholds, the employed organic system may be damaged so as to cause a partial or total deficiency of its functions. An irreversible reduction of functions may appear when stress is far too high (acute damage) or when recovery is impossible for a longer time (chronic damage). A typical example of such damage is noise-induced hearing loss.
Models of Fatigue
Fatigue can be many-sided, depending on the form and combi-nation of strain, and a general definition of it is yet not possible. The biological proceedings of fatigue are in general not measurable in a direct way, so that the definitions are mainly oriented towards the fatigue symptoms. These fatigue symptoms can be divided, for example, into the following three categories.
- Physiological symptoms: fatigue is interpreted as a decrease of functions of organs or of the whole organism. It results in physiological reactions, e.g., in an increase of heart rate frequency or electrical muscle activity (Laurig 1970).
- Behavioural symptoms: fatigue is interpreted mainly as a decrease of performance parameters. Examples are increasing errors when solving certain tasks, or an increasing variability of performance.
- Psycho-physical symptoms: fatigue is interpreted as an increase of the feeling of exertion and deterioration of sensation, depending on the intensity, duration and composition of stress factors.
In the process of fatigue all three of these symptoms may play a role, but they may appear at different points in time.
Physiological reactions in organic systems, particularly those involved in the work, may appear first. Later on, the feelings of exertion may be affected. Changes in performance are manifested generally in a decreasing regularity of work or in an increasing quantity of errors, although the mean of the performance may not yet be affected. On the contrary, with appropriate motivation, the working person may even try to maintain performance through will-power. The next step may be a clear reduction of performance ending with a breakdown of performance. The physiological symptoms may lead to a breakdown of the organism including changes of the structure of personality and in exhaustion. The process of fatigue is explained in the theory of successive destabilization (Luczak 1983).
The principal trend of fatigue and recovery is shown in figure 2.
Figure 2. Principal trend of fatigue and recovery

Prognosis of Fatigue and Recovery
In the field of ergonomics there is a special interest in predicting fatigue dependent on the intensity, duration and composition of stress factors and to determine the necessary recovery time. Table 1 shows those different activity levels and consideration periods and possible reasons of fatigue and different possibilities of recovery.
Table 1. Fatigue and recovery dependent on activity levels
|
Level of activity |
Period |
Fatigue from |
Recovery by |
|
Work life |
Decades |
Overexertion for |
Retirement |
|
Phases of work life |
Years |
Overexertion for |
Holidays |
|
Sequences of |
Months/weeks |
Unfavourable shift |
Weekend, free |
|
One work shift |
One day |
Stress above |
Free time, rest |
|
Tasks |
Hours |
Stress above |
Rest period |
|
Part of a task |
Minutes |
Stress above |
Change of stress |
In ergonomic analysis of stress and fatigue for determining the necessary recovery time, considering the period of one working day is the most important. The methods of such analyses start with the determination of the different stress factors as a function of time (Laurig 1992) (figure 3).
Figure 3. Stress as a function of time
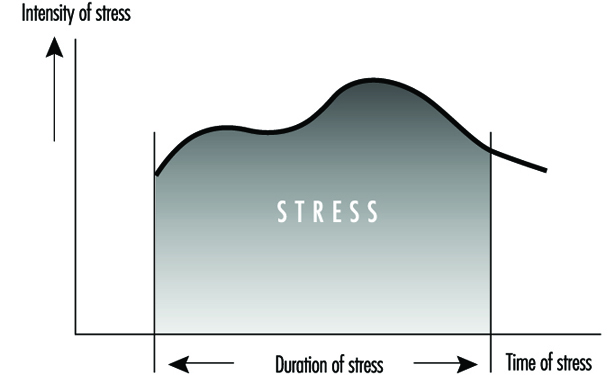
The stress factors are determined from the specific work content and from the conditions of work. Work content could be the production of force (e.g., when handling loads), the coordination of motor and sensory functions (e.g., when assembling or crane operating), the conversion of information into reaction (e.g., when controlling), the transformations from input to output information (e.g., when programming, translating) and the production of information (e.g., when designing, problem solving). The conditions of work include physical (e.g., noise, vibration, heat), chemical (chemical agents) and social (e.g., colleagues, shift work) aspects.
In the easiest case there will be a single important stress factor while the others can be neglected. In those cases, especially when the stress factors results from muscular work, it is often possible to calculate the necessary rest allowances, because the basic concepts are known.
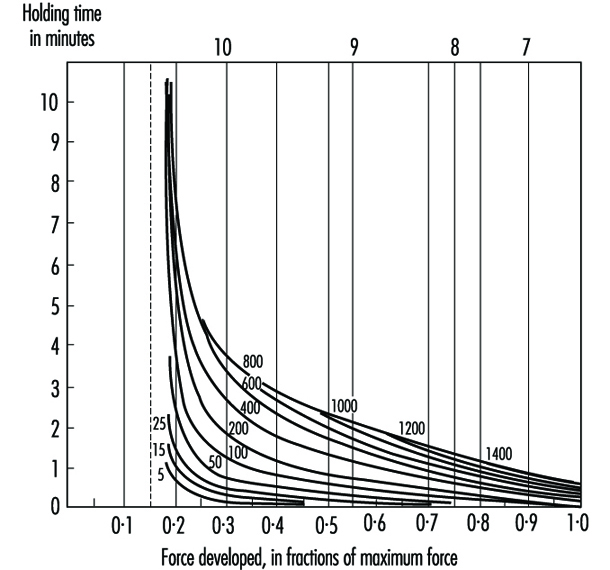
For example, the sufficient rest allowance in static muscle work depends on the force and duration of muscular contraction as in an exponential function linked by multiplication according to the formula:
![]()
with
R.A. = Rest allowance in percentage of t
t = duration of contraction (working period) in minutes
T = maximal possible duration of contraction in minutes
f = the force needed for the static force and
F = maximal force.
The connection between force, holding time and rest allowances is shown in figure 4.
Figure 4. Percentage rest allowances for various combinations of holding forces and time
Similar laws exist for heavy dynamic muscular work (Rohmert 1962), active light muscular work (Laurig 1974) or different industrial muscular work (Schmidtke 1971). More rarely you find comparable laws for non-physical work, e.g., for computing (Schmidtke 1965). An overview of existing methods for determining rest allowances for mainly isolated muscle and non-muscle work is given by Laurig (1981) and Luczak (1982).
More difficult is the situation where a combination of different stress factors exists, as shown in figure 5, which affect the working person simultaneously (Laurig 1992).
Figure 5. The combination of two stress factors

The combination of two stress factors, for example, can lead to different strain reactions depending on the laws of combination. The combined effect of different stress factors can be indifferent, compensatory or cumulative.
In the case of indifferent combination laws, the different stress factors have an effect on different subsystems of the organism. Each of these subsystems can compensate for the strain without the strain being fed into a common subsystem. The overall strain depends on the highest stress factor, and thus laws of superposition are not needed.
A compensatory effect is given when the combination of different stress factors leads to a lower strain than does each stress factor alone. The combination of muscular work and low temperatures can reduce the overall strain, because low temperatures allow the body to lose heat which is produced by the muscular work.
A cumulative effect arises if several stress factors are superimposed, that is, they must pass through one physiological “bottleneck”. An example is the combination of muscular work and heat stress. Both stress factors affect the circulatory system as a common bottleneck with resultant cumulative strain.
Possible combination effects between muscle work and physical conditions are described in Bruder (1993) (see table 2).
Table 2. Rules of combination effects of two stress factors on strain
|
Cold |
Vibration |
Illumination |
Noise |
|
|
Heavy dynamic work |
– |
+ |
0 |
0 |
|
Active light muscle work |
+ |
+ |
0 |
0 |
|
Static muscle work |
+ |
+ |
0 |
0 |
0 indifferent effect; + cumulative effect; – compensatory effect.
Source: Adapted from Bruder 1993.
For the case of the combination of more than two stress factors, which is the normal situation in practice, only limited scientific knowledge is available. The same applies for the successive combination of stress factors, (i.e., the strain effect of different stress factors which affect the worker successively). For such cases, in practice, the necessary recovery time is determined by measuring physiological or psychological parameters and using them as integrating values.
Impact of Random Measurement Error
Errors in exposure measurement may have different impacts on the exposure-disease relationship being studied, depending on how the errors are distributed. If an epidemiological study has been conducted blindly (i.e., measurements have been taken with no knowledge of the disease or health status of the study participants) we expect that measurement error will be evenly distributed across the strata of disease or health status.
Table 1 provides an example: suppose we recruit a cohort of people exposed at work to a toxicant, in order to investigate a frequent disease. We determine the exposure status only at recruitment (T0), and not at any further points in time during follow-up. However, let us say that a number of individuals do, in fact, change their exposure status in the following year: at time T1, 250 of the original 1,200 exposed people have ceased being exposed, while 150 of the original 750 non-exposed people have started to be exposed to the toxicant. Therefore, at time T1, 1,100 individuals are exposed and 850 are not exposed. As a consequence, we have “misclassification” of exposure, based on our initial measurement of exposure status at time T0. These individuals are then traced after 20 years (at time T2) and the cumulative risk of disease is evaluated. (The assumption being made in the example is that only exposure of more than one year is a concern.)
Table 1. Hypothetical cohort of 1950 individuals (exposed and unexposed at work), recruited at time T0 and whose disease status is ascertained at time T2
|
Time |
|||
|
T0 |
T1 |
T2 |
|
Exposed workers 1200 250 quit exposure 1100 (1200-250+150)
Cases of disease at time T2 = 220 among exposed workers
Non-exposed workers 750 150 start exposure 850 (750-150+250)
Cases of disease at time T2 = 85 among non-exposed workers
The true risk of disease at time T2 is 20% among exposed workers (220/1100),
and 10% in non-exposed workers (85/850) (risk ratio = 2.0).
Estimated risk at T2 of disease among those classified as exposed at T0: 20%
(i.e., true risk in those exposed) ´ 950 (i.e., 1200-250)+ 10%
(i.e., true risk in non-exposed) ´ 250 = (190+25)/1200 = 17.9%
Estimated risk at T2 of disease among those classified as non-exposed at
T0: 20% (i.e., true risk in those exposed) ´ 150 +10%
(i.e., true risk innon-exposed) ´ 600 (i.e., 750-150) = (30+60)/750 = 12%
Estimated risk ratio = 17.9% / 12% = 1.49
Misclassification depends, in this example, on the study design and the characteristics of the population, rather than on technical limitations of the exposure measurement. The effect of misclassification is such that the “true” ratio of 2.0 between the cumulative risk among exposed people and non-exposed people becomes an “observed” ratio of 1.49 (table 1). This underestimation of the risk ratio arises from a “blurring” of the relationship between exposure and disease, which occurs when the misclassification of exposure, as in this case, is evenly distributed according to the disease or health status (i.e., the exposure measurement is not influenced by whether or not the person suffered from the disease that we are studying).
By contrast, either underestimation or overestimation of the association of interest may occur when exposure misclassification is not evenly distributed across the outcome of interest. In the example, we may have bias, and not only a blurring of the aetiologic relationship, if classification of exposure depends on the disease or health status among the workers. This could arise, for example, if we decide to collect biological samples from a group of exposed workers and from a group of unexposed workers, in order to identify early changes related to exposure at work. Samples from the exposed workers might then be analysed in a more accurate way than samples from those unexposed; scientific curiosity might lead the researcher to measure additional biomarkers among the exposed people (including, e.g., DNA adducts in lymphocytes or urinary markers of oxidative damage to DNA), on the assumption that these people are scientifically “more interesting”. This is a rather common attitude which, however, could lead to serious bias.
Statistical Methods
There is much debate on the role of statistics in epidemiological research on causal relationships. In epidemiology, statistics is primarily a collection of methods for assessing data based on human (and also on animal) populations. In particular, statistics is a technique for the quantification and measurement of uncertain phenomena. All the scientific investigations which deal with non-deterministic, variable aspects of reality could benefit from statistical methodology. In epidemiology, variability is intrinsic to the unit of observation—a person is not a deterministic entity. While experimental designs would be improved in terms of better meeting the assumptions of statistics in terms of random variation, for ethical and practical reasons this approach is not too common. Instead, epidemiology is engaged in observational research which has associated with it both random and other sources of variability.
Statistical theory is concerned with how to control unstructured variability in the data in order to make valid inferences from empirical observations. Lacking any explanation for the variable behaviour of the phenomenon studied, statistics assumes it as random—that is, non-systematic deviations from some average state of nature (see Greenland 1990 for a criticism of these assumptions).
Science relies on empirical evidence to demonstrate whether its theoretical models of natural events have any validity. Indeed, the methods used from statistical theory determine the degree to which observations in the real world conform to the scientists’ view, in mathematical model form, of a phenomenon. Statistical methods, based in mathematics, have therefore to be carefully selected; there are plenty of examples about “how to lie with statistics”. Therefore, epidemiologists should be aware of the appropriateness of the techniques they apply to measure the risk of disease. In particular, great care is needed when interpreting both statistically significant and statistically non-significant results.
The first meaning of the word statistics relates to any summary quantity computed on a set of values. Descriptive indices or statistics such as the arithmetic average, the median or the mode, are widely used to summarize the information in a series of observations. Historically, these summary descriptors were used for administrative purposes by states, and therefore they were named statistics. In epidemiology, statistics that are commonly seen derive from the comparisons inherent to the nature of epidemiology, which asks questions such as: “Is one population at greater risk of disease than another?” In making such comparisons, the relative risk is a popular measure of the strength of association between an individual characteristic and the probability of becoming ill, and it is most commonly applied in aetiological research; attributable risk is also a measure of association between individual characteristics and disease occurrence, but it emphasizes the gain in terms of number of cases spared by an intervention which removes the factor in question—it is mostly applied in public health and preventive medicine.
The second meaning of the word statistics relates to the collection of techniques and the underlying theory of statistical inference. This is a particular form of inductive logic which specifies the rules for obtaining a valid generalization from a particular set of empirical observations. This generalization would be valid provided some assumptions are met. This is the second way in which an uneducated use of statistics can deceive us: in observational epidemiology, it is very difficult to be sure of the assumptions implied by statistical techniques. Therefore, sensitivity analysis and robust estimators should be companions of any correctly conducted data analysis. Final conclusions also should be based on overall knowledge, and they should not rely exclusively on the findings from statistical hypothesis testing.
Definitions
A statistical unit is the element on which the empirical observations are made. It could be a person, a biological specimen or a piece of raw material to be analysed. Usually the statistical units are independently chosen by the researcher, but sometimes more complex designs can be set up. For example, in longitudinal studies, a series of determinations is made on a collection of persons over time; the statistical units in this study are the set of determinations, which are not independent, but structured by their respective connections to each person being studied. Lack of independence or correlation among statistical units deserves special attention in statistical analysis.
A variable is an individual characteristic measured on a given statistical unit. It should be contrasted with a constant, a fixed individual characteristic—for example, in a study on human beings, having a head or a thorax are constants, while the gender of a single member of the study is a variable.
Variables are evaluated using different scales of measurement. The first distinction is between qualitative and quantitative scales. Qualitative variables provide different modalities or categories. If each modality cannot be ranked or ordered in relation to others—for example, hair colour, or gender modalities—we denote the variable as nominal. If the categories can be ordered—like degree of severity of an illness—the variable is called ordinal. When a variable consists of a numeric value, we say that the scale is quantitative. A discrete scale denotes that the variable can assume only some definite values—for example, integer values for the number of cases of disease. A continuous scale is used for those measures which result in real numbers. Continuous scales are said to be interval scales when the null value has a purely conventional meaning. That is, a value of zero does not mean zero quantity—for example, a temperature of zero degrees Celsius does not mean zero thermal energy. In this instance, only differences among values make sense (this is the reason for the term “interval” scale). A real null value denotes a ratio scale. For a variable measured on that scale, ratios of values also make sense: indeed, a twofold ratio means double the quantity. For example, to say that a body has a temperature two times greater than a second body means that it has two times the thermal energy of the second body, provided that the temperature is measured on a ratio scale (e.g., in Kelvin degrees). The set of permissible values for a given variable is called the domain of the variable.
Statistical Paradigms
Statistics deals with the way to generalize from a set of particular observations. This set of empirical measurements is called a sample. From a sample, we calculate some descriptive statistics in order to summarize the information collected.
The basic information that is generally required in order to characterize a set of measures relates to its central tendency and to its variability. The choice between several alternatives depends on the scale used to measure a phenomenon and on the purposes for which the statistics are computed. In table 1 different measures of central tendency and variability (or, dispersion) are described and associated with the appropriate scale of measurement.
Table 1. Indices of central tendency and dispersion by scale of measurement
|
Scale of measurement |
||||
|
Qualitative |
Quantitative |
|||
|
Indices |
Definition |
Nominal |
Ordinal |
Interval/ratio |
|
Arithmetic mean |
Sum of the observed values divided by the total number of observations |
|
|
x |
|
Median |
Midpoint value of the observed distribution |
|
x |
x |
|
Mode |
Most frequent value |
x |
x |
x |
|
Range |
Lowest and highest values of the distribution |
|
x |
x |
|
Variance |
Sum of the squared difference of each value from the mean divided by the total number of observations minus 1 |
|
|
x |
The descriptive statistics computed are called estimates when we use them as a substitute for the analogous quantity of the population from which the sample has been selected. The population counterparts of the estimates are constants called parameters. Estimates of the same parameter can be obtained using different statistical methods. An estimate should be both valid and precise.
The population-sample paradigm implies that validity can be assured by the way the sample is selected from the population. Random or probabilistic sampling is the usual strategy: if each member of the population has the same probability of being included in the sample, then, on average, our sample should be representative of the population and, moreover, any deviation from our expectation could be explained by chance. The probability of a given deviation from our expectation also can be computed, provided that random sampling has been performed. The same kind of reasoning applies to the estimates calculated for our sample with regard to the population parameters. We take, for example, the arithmetic average from our sample as an estimate of the mean value for the population. Any difference, if it exists, between the sample average and the population mean is attributed to random fluctuations in the process of selection of the members included in the sample. We can calculate the probability of any value of this difference, provided the sample was randomly selected. If the deviation between the sample estimate and the population parameter cannot be explained by chance, the estimate is said to be biased. The design of the observation or experiment provides validity to the estimates and the fundamental statistical paradigm is that of random sampling.
In medicine, a second paradigm is adopted when a comparison among different groups is the aim of the study. A typical example is the controlled clinical trial: a set of patients with similar characteristics is selected on the basis of pre-defined criteria. No concern for representativeness is made at this stage. Each patient enrolled in the trial is assigned by a random procedure to the treatment group—which will receive standard therapy plus the new drug to be evaluated—or to the control group—receiving the standard therapy and a placebo. In this design, the random allocation of the patients to each group replaces the random selection of members of the sample. The estimate of the difference between the two groups can be assessed statistically because, under the hypothesis of no efficacy of the new drug, we can calculate the probability of any non-zero difference.
In epidemiology, we lack the possibility of assembling randomly exposed and non-exposed groups of people. In this case, we still can use statistical methods, as if the groups analysed had been randomly selected or allocated. The correctness of this assumption relies mainly on the study design. This point is particularly important and underscores the importance of epidemiological study design over statistical techniques in biomedical research.
Signal and Noise
The term random variable refers to a variable for which a defined probability is associated with each value it can assume. The theoretical models for the distribution of the probability of a random variable are population models. The sample counterparts are represented by the sample frequency distribution. This is a useful way to report a set of data; it consists of a Cartesian plane with the variable of interest along the horizontal axis and the frequency or relative frequency along the vertical axis. A graphic display allows us to readily see what is (are) the most frequent value(s) and how the distribution is concentrated around certain central values like the arithmetic average.
For the random variables and their probability distributions, we use the terms parameters, mean expected value (instead of arithmetic average) and variance. These theoretical models describe the variability in a given phenomenon. In information theory, the signal is represented by the central tendency (for example, the mean value), while the noise is measured by a dispersion index (such as the variance).
To illustrate statistical inference, we will use the binomial model. In the sections which follow, the concepts of point estimates and confidence intervals, tests of hypotheses and probability of erroneous decisions, and power of a study will be introduced.
Table 2. Possible outcomes of a binomial experiment (yes = 1, no = 0) and their probabilities (n = 3)
|
Worker |
Probability |
||
|
A |
B |
C |
|
|
0 |
0 |
0 |
|
|
1 |
0 |
0 |
|
|
0 |
1 |
0 |
|
|
0 |
0 |
1 |
|
|
0 |
1 |
1 |
|
|
1 |
0 |
1 |
|
|
1 |
1 |
0 |
|
|
1 |
1 |
1 |
|
An Example: The Binomial Distribution
In biomedical research and epidemiology, the most important model of stochastic variation is the binomial distribution. It relies on the fact that most phenomena behave as a nominal variable with only two categories: for example, the presence/absence of disease: alive/dead, or recovered/ill. In such circumstances, we are interested in the probability of success—that is, in the event of interest (e.g., presence of disease, alive or recovery)—and in the factors or variables that can alter it. Let us consider n = 3 workers, and suppose that we are interested in the probability, p, of having a visual impairment (yes/no). The result of our observation could be the possible outcomes in table 2.
Table 3. Possible outcomes of a binomial experiment (yes = 1, no = 0) and their probabilities (n = 3)
|
Number of successes |
Probability |
|
0 |
|
|
1 |
|
|
2 |
|
|
3 |
|
The probability of any of these event combinations is easily obtained by considering p, the (individual) probability of success, constant for each subject and independent from other outcomes. Since we are interested in the total number of successes and not in a specific ordered sequence, we can rearrange the table as follows (see table 3) and, in general, express the probability of x successes P(x) as:
![]()
where x is the number of successes and the notation x! denotes the factorial of x, i.e., x! = x×(x–1)×(x–2)…×1.
When we consider the event “being/not being ill”, the individual probability, ![]() refers to the state in which the subject is presumed; in epidemiology, this probability is called “prevalence”. To estimate p, we use the sample proportion:
refers to the state in which the subject is presumed; in epidemiology, this probability is called “prevalence”. To estimate p, we use the sample proportion:
p = x/n
with variance:
![]()
In an hypothetical infinite series of replicated samples of the same size n, we would obtain different sample proportions p = x/n, with probabilities given by the binomial formula. The “true” value of ![]() is estimated by each sample proportion, and a confidence interval for p, that is, the set of likely values for p, given the observed data and a pre-defined level of confidence (say 95%), is estimated from the binomial distribution as the set of values for p which gives a probability of x greater than a pre-specified value (say 2.5%). For a hypothetical experiment in which we observed x = 15 successes in n = 30 trials, the estimated probability of success is:
is estimated by each sample proportion, and a confidence interval for p, that is, the set of likely values for p, given the observed data and a pre-defined level of confidence (say 95%), is estimated from the binomial distribution as the set of values for p which gives a probability of x greater than a pre-specified value (say 2.5%). For a hypothetical experiment in which we observed x = 15 successes in n = 30 trials, the estimated probability of success is:
Table 4. Binomial distribution. Probabilities for different values of ![]() for x = 15 successes in n = 30 trials
for x = 15 successes in n = 30 trials
|
|
Probability |
|
0.200 |
0.0002 |
|
0.300 |
0.0116 |
|
0.334 |
0.025 |
|
0.400 |
0.078 |
|
0.500 |
0.144 |
|
0.600 |
0.078 |
|
0.666 |
0.025 |
|
0.700 |
0.0116 |
The 95% confidence interval for p, obtained from table 4, is 0.334 – 0.666. Each entry of the table shows the probability of x = 15 successes in n = 30 trials computed with the binomial formula; for example, for![]() = 0.30, we obtain from:
= 0.30, we obtain from:
![]()
For n large and p close to 0.5 we can use an approximation based on the Gaussian distribution:
![]()
where za /2 denotes the value of the standard Gaussian distribution for a probability
P (|z| ³ za /2) = a/2;
1 – a being the chosen confidence level. For the example considered,![]() = 15/30 = 0.5; n = 30 and from the standard Gaussian table z0.025 = 1.96. The 95% confidence interval results in the set of values 0.321 – 0.679, obtained by substituting p = 0.5, n = 30, and z0.025 = 1.96 into the above equation for the Gaussian distribution. Note that these values are close to the exact values computed before.
= 15/30 = 0.5; n = 30 and from the standard Gaussian table z0.025 = 1.96. The 95% confidence interval results in the set of values 0.321 – 0.679, obtained by substituting p = 0.5, n = 30, and z0.025 = 1.96 into the above equation for the Gaussian distribution. Note that these values are close to the exact values computed before.
Statistical tests of hypotheses comprise a decision procedure about the value of a population parameter. Suppose, in the previous example, that we want to address the proposition that there is an elevated risk of visual impairment among workers of a given plant. The scientific hypothesis to be tested by our empirical observations then is “there is an elevated risk of visual impairment among workers of a given plant”. Statisticians demonstrate such hypotheses by falsifying the complementary hypothesis “there is no elevation of the risk of visual impairment”. This follows the mathematical demonstration per absurdum and, instead of verifying an assertion, empirical evidence is used only to falsify it. The statistical hypothesis is called the null hypothesis. The second step involves specifying a value for the parameter of that probability distribution used to model the variability in the observations. In our examples, since the phenomenon is binary (i.e., presence/absence of visual impairment), we choose the binomial distribution with parameter p, the probability of visual impairment. The null hypothesis asserts that![]() = 0.25, say. This value is chosen from the collection of knowledge about the topic and a priori knowledge of the usual prevalence of visual impairment in non-exposed (i.e., non-worker) populations. Suppose our data produced an estimate
= 0.25, say. This value is chosen from the collection of knowledge about the topic and a priori knowledge of the usual prevalence of visual impairment in non-exposed (i.e., non-worker) populations. Suppose our data produced an estimate![]() = 0.50, from the 30 workers examined.
= 0.50, from the 30 workers examined.
Can we reject the null hypothesis?
If yes, in favour of what alternative hypothesis?
We specify an alternative hypothesis as a candidate should the evidence dictate that the null hypothesis be rejected. Non-directional (two-sided) alternative hypotheses state that the population parameter is different from the value stated in the null hypothesis; directional (one-sided) alternative hypotheses state that the population parameter is greater (or lesser) than the null value.
Table 5. Binomial distribution. Probabilities of success for ![]() = 0.25 in n = 30 trials
= 0.25 in n = 30 trials
|
X |
Probability |
Cumulative probability |
|
0 |
0.0002 |
0.0002 |
|
1 |
0.0018 |
0.0020 |
|
2 |
0.0086 |
0.0106 |
|
3 |
0.0269 |
0.0374 |
|
4 |
0.0604 |
0.0979 |
|
5 |
0.1047 |
0.2026 |
|
6 |
0.1455 |
0.3481 |
|
7 |
0.1662 |
0.5143 |
|
8 |
0.1593 |
0.6736 |
|
9 |
0.1298 |
0.8034 |
|
10 |
0.0909 |
0.8943 |
|
11 |
0.0551 |
0.9493 |
|
12 |
0.0291 |
0.9784 |
|
13 |
0.0134 |
0.9918 |
|
14 |
0.0054 |
0.9973 |
|
15 |
0.0019 |
0.9992 |
|
16 |
0.0006 |
0.9998 |
|
17 |
0.0002 |
1.0000 |
|
. |
. |
. |
|
30 |
0.0000 |
1.0000 |
Under the null hypothesis, we can calculate the probability distribution of the results of our example. Table 5 shows, for![]() = 0.25 and n = 30, the probabilities (see equation (1)) and the cumulative probabilities:
= 0.25 and n = 30, the probabilities (see equation (1)) and the cumulative probabilities:
![]()
From this table, we obtain the probability of having x ³15 workers with visual impairment
P(x ³15) = 1 – P(x <15) = 1 – 0.9992 = 0.0008
This means that it is highly improbable that we would observe 15 or more workers with visual impairment if they experienced the prevalence of disease of the non-exposed populations. Therefore, we could reject the null hypothesis and affirm that there is a higher prevalence of visual impairment in the population of workers that was studied.
When n×p ³ 5 and n×(1-![]() ) ³ 5, we can use the Gaussian approximation:
) ³ 5, we can use the Gaussian approximation:

From the table of the standard Gaussian distribution we obtain:
P(|z|>2.95) = 0.0008
in close agreement with the exact results. From this approximation we can see that the basic structure of a statistical test of hypothesis consists of the ratio of signal to noise. In our case, the signal is (p–![]() ), the observed deviation from the null hypothesis, while the noise is the standard deviation of P:
), the observed deviation from the null hypothesis, while the noise is the standard deviation of P:
![]()
The greater the ratio, the lesser the probability of the null value![]() .
.
In making decisions about statistical hypotheses, we can incur two kinds of errors: a type I error, rejection of the null hypothesis when it is true; or a type II error, acceptance of the null hypothesis when it is false. The probability level, or p-value, is the probability of a type I error, denoted by the Greek letter a. This is calculated from the probability distribution of the observations under the null hypothesis. It is customary to predefine an a-error level (e.g., 5%, 1%) and reject the null hypothesis when the result of our observation has a probability equal to or less than this so-called critical level.
The probability of a type II error is denoted by the Greek letter β. To calculate it, we need to specify, in the alternative hypothesis, α value for the parameter to be tested (in our example, α value for![]() ). Generic alternative hypotheses (different from, greater than, less than) are not useful. In practice, the β-value for a set of alternative hypotheses is of interest, or its complement, which is called the statistical power of the test. For example, fixing the α-error value at 5%, from table 5, we find:
). Generic alternative hypotheses (different from, greater than, less than) are not useful. In practice, the β-value for a set of alternative hypotheses is of interest, or its complement, which is called the statistical power of the test. For example, fixing the α-error value at 5%, from table 5, we find:
P(x ³12) <0.05
under the null hypothesis![]() = 0.25. If we were to observe at least x = 12 successes, we would reject the null hypothesis. The corresponding β values and the power for x = 12 are given by table 6.
= 0.25. If we were to observe at least x = 12 successes, we would reject the null hypothesis. The corresponding β values and the power for x = 12 are given by table 6.
Table 6. Type II error and power for x = 12, n = 30, α = 0.05
|
|
β |
Power |
|
0.30 |
0.9155 |
0.0845 |
|
0.35 |
0.7802 |
0.2198 |
|
0.40 |
0.5785 |
0.4215 |
|
0.45 |
0.3592 |
0.6408 |
|
0.50 |
0.1808 |
0.8192 |
|
0.55 |
0.0714 |
0.9286 |
In this case our data cannot discriminate whether![]() is greater than the null value of 0.25 but less than 0.50, because the power of the study is too low (<80%) for those values of
is greater than the null value of 0.25 but less than 0.50, because the power of the study is too low (<80%) for those values of![]() <0.50—that is, the sensitivity of our study is 8% for
<0.50—that is, the sensitivity of our study is 8% for![]() = 0.3, 22% for
= 0.3, 22% for![]() = 0.35,…, 64% for
= 0.35,…, 64% for![]() = 0.45.
= 0.45.
The only way to achieve a lower β, or a higher level of power, would be to increase the size of the study. For example, in table 7 we report β and power for n = 40; as expected, we should be able to detect a ![]() value greater than 0.40.
value greater than 0.40.
Table 7. Type II error and power for x = 12, n = 40, α = 0.05
|
|
β |
Power |
|
0.30 |
0.5772 |
0.4228 |
|
0.35 |
0.3143 |
0.6857 |
|
0.40 |
0.1285 |
0.8715 |
|
0.45 |
0.0386 |
0.8614 |
|
0.50 |
0.0083 |
0.9917 |
|
0.55 |
0.0012 |
0.9988 |
Study design is based on careful scrutiny of the set of alternative hypotheses which deserve consideration and guarantee power to the study providing an adequate sample size.
In the epidemiological literature, the relevance of providing reliable risk estimates has been emphasized. Therefore, it is more important to report confidence intervals (either 95% or 90%) than a p-value of a test of a hypothesis. Following the same kind of reasoning, attention should be given to the interpretation of results from small-sized studies: because of low power, even intermediate effects could be undetected and, on the other hand, effects of great magnitude might not be replicated subsequently.
Advanced Methods
The degree of complexity of the statistical methods used in the occupational medicine context has been growing over the last few years. Major developments can be found in the area of statistical modelling. The Nelder and Wedderburn family of non-Gaussian models (Generalized Linear Models) has been one of the most striking contributions to the increase of knowledge in areas such as occupational epidemiology, where the relevant response variables are binary (e.g., survival/death) or counts (e.g., number of industrial accidents).
This was the starting point for an extensive application of regression models as an alternative to the more traditional types of analysis based on contingency tables (simple and stratified analysis). Poisson, Cox and logistic regression are now routinely used for the analysis of longitudinal and case-control studies, respectively. These models are the counterpart of linear regression for categorical response variables and have the elegant feature of providing directly the relevant epidemiological measure of association. For example, the coefficients of Poisson regression are the logarithm of the rate ratios, while those of logistic regression are the log of the odds ratios.
Taking this as a benchmark, further developments in the area of statistical modelling have taken two main directions: models for repeated categorical measures and models which extend the Generalized Linear Models (Generalized Additive Models). In both instances, the aims are focused on increasing the flexibility of the statistical tools in order to cope with more complex problems arising from reality. Repeated measures models are needed in many occupational studies where the units of analysis are at the sub-individual level. For example:
- The study of the effect of working conditions on carpal tunnel syndrome has to consider both hands of a person, which are not independent from one other.
- The analysis of time trends of environmental pollutants and their effect on children’s respiratory systems can be evaluated using extremely flexible models since the exact functional form of the dose-response relationship is difficult to obtain.
A parallel and probably faster development has been seen in the context of Bayesian statistics. The practical barrier of using Bayesian methods collapsed after the introduction of computer-intensive methods. Monte Carlo procedures such as Gibbs sampling schemes have allowed us to avoid the need for numerical integration for computing the posterior distributions which represented the most challenging feature of Bayesian methods. The number of applications of Bayesian models in real and complex problems have found increasing space in applied journals. For example, geographical analyses and ecological correlations at the small area level and AIDS prediction models are more and more often tackled using Bayesian approaches. These developments are welcomed because they represent not only an increase in the number of alternative statistical solutions which could be employed in the analysis of epidemiological data, but also because the Bayesian approach can be considered a more sound strategy.
Causality Assessment and Ethics in Epidemiological Research
The preceding articles of this chapter have shown the need for a careful evaluation of the study design in order to draw credible inferences from epidemiological observations. Although it has been claimed that inferences in observational epidemiology are weak because of the non-experimental nature of the discipline, there is no built-in superiority of randomized controlled trials or other types of experimental design over well-planned observation (Cornfield 1954). However, to draw sound inferences implies a thorough analysis of the study design in order to identify potential sources of bias and confounding. Both false positive and false negative results can originate from different types of bias.
In this article, some of the guidelines that have been proposed to assess the causal nature of epidemiological observations are discussed. In addition, although good science is a premise for ethically correct epidemiological research, there are additional issues that are relevant to ethical concerns. Therefore, we have devoted some discussion to the analysis of ethical problems that may arise in doing epidemiological studies.
Causality Assessment
Several authors have discussed causality assessment in epidemiology (Hill 1965; Buck 1975; Ahlbom 1984; Maclure 1985; Miettinen 1985; Rothman 1986; Weed 1986; Schlesselman 1987; Maclure 1988; Weed 1988; Karhausen 1995). One of the main points of discussion is whether epidemiology uses or should use the same criteria for the ascertainment of cause-effect relationships as used in other sciences.
Causes should not be confused with mechanisms. For example, asbestos is a cause of mesothelioma, whereas oncogene mutation is a putative mechanism. On the basis of the existing evidence, it is likely that (a) different external exposures can act at the same mechanistic stages and (b) usually there is not a fixed and necessary sequence of mechanistic steps in the development of disease. For example, carcinogenesis is interpreted as a sequence of stochastic (probabilistic) transitions, from gene mutation to cell proliferation to gene mutation again, that eventually leads to cancer. In addition, carcinogenesis is a multifactorial process—that is, different external exposures are able to affect it and none of them is necessary in a susceptible person. This model is likely to apply to several diseases in addition to cancer.
Such a multifactorial and probabilistic nature of most exposure-disease relationships implies that disentangling the role played by one specific exposure is problematic. In addition, the observational nature of epidemiology prevents us from conducting experiments that could clarify aetiologic relationships through a wilful alteration of the course of the events. The observation of a statistical association between exposure and disease does not mean that the association is causal. For example, most epidemiologists have interpreted the association between exposure to diesel exhaust and bladder cancer as a causal one, but others have claimed that workers exposed to diesel exhaust (mostly truck and taxi drivers) are more often cigarette smokers than are non-exposed individuals. The observed association, according to this claim, thus would be “confounded” by a well-known risk factor like smoking.
Given the probabilistic-multifactorial nature of most exposure-disease associations, epidemiologists have developed guidelines to recognize relationships that are likely to be causal. These are the guidelines originally proposed by Sir Bradford Hill for chronic diseases (1965):
- strength of the association
- dose-response effect
- lack of temporal ambiguity
- consistency of the findings
- biological plausibility
- coherence of the evidence
- specificity of the association.
These criteria should be considered only as general guidelines or practical tools; in fact, scientific causal assessment is an iterative process centred around measurement of the exposure-disease relationship. However, Hill’s criteria often are used as a concise and practical description of causal inference procedures in epidemiology.
Let us consider the example of the relationship between exposure to vinyl chloride and liver angiosarcoma, applying Hill’s criteria.
The usual expression of the results of an epidemiological study is a measure of the degree of association between exposure and disease (Hill’s first criterion). A relative risk (RR) that is greater than unity means that there is a statistical association between exposure and disease. For instance, if the incidence rate of liver angiosarcoma is usually 1 in 10 million, but it is 1 in 100,000 among those exposed to vinyl chloride, then the RR is 100 (that is, people who work with vinyl chloride have a 100 times increased risk of developing angiosarcoma compared to people who do not work with vinyl chloride).
It is more likely that an association is causal when the risk increases with increasing levels of exposure (dose-response effect, Hill’s second criterion) and when the temporal relationship between exposure and disease makes sense on biological grounds (the exposure precedes the effect and the length of this “induction” period is compatible with a biological model of disease; Hill’s third criterion). In addition, an association is more likely to be causal when similar results are obtained by others who have been able to replicate the findings in different circumstances (“consistency”, Hill’s fourth criterion).
A scientific analysis of the results requires an evaluation of biological plausibility (Hill’s fifth criterion). This can be achieved in different ways. For example, a simple criterion is to evaluate whether the alleged “cause” is able to reach the target organ (e.g., inhaled substances that do not reach the lung cannot circulate in the body). Also, supporting evidence from animal studies is helpful: the observation of liver angiosarcomas in animals treated with vinyl chloride strongly reinforces the association observed in man.
Internal coherence of the observations (for example, the RR is similarly increased in both genders) is an important scientific criterion (Hill’s sixth criterion). Causality is more likely when the relationship is very specific—that is, involves rare causes and/or rare diseases, or a specific histologic type/subgroup of patients (Hill’s seventh criterion).
“Enumerative induction” (the simple enumeration of instances of association between exposure and disease) is insufficient to describe completely the inductive steps in causal reasoning. Usually, the result of enumerative induction produces a complex and still confused observation because different causal chains or, more frequently, a genuine causal relationship and other irrelevant exposures, are entangled. Alternative explanations have to be eliminated through “eliminative induction”, showing that an association is likely to be causal because it is not “confounded” with others. A simple definition of an alternative explanation is “an extraneous factor whose effect is mixed with the effect of the exposure of interest, thus distorting the risk estimate for the exposure of interest” (Rothman 1986).
The role of induction is expanding knowledge, whereas deduction’s role is “transmitting truth” (Giere 1979). Deductive reasoning scrutinizes the study design and identifies associations which are not empirically true, but just logically true. Such associations are not a matter of fact, but logical necessities. For example, a selection bias occurs when the exposed group is selected among ill people (as when we start a cohort study recruiting as “exposed” to vinyl chloride a cluster of liver angiosarcoma cases) or when the unexposed group is selected among healthy people. In both instances the association which is found between exposure and disease is necessarily (logically) but not empirically true (Vineis 1991).
To conclude, even when one considers its observational (non-experimental) nature, epidemiology does not use inferential procedures that differ substantially from the tradition of other scientific disciplines (Hume 1978; Schaffner 1993).
Ethical Issues in Epidemiological Research
Because of the subtleties involved in inferring causation, special care has to be exercised by epidemiologists in interpreting their studies. Indeed, several concerns of an ethical nature flow from this.
Ethical issues in epidemiological research have become a subject of intense discussion (Schulte 1989; Soskolne 1993; Beauchamp et al. 1991). The reason is evident: epidemiologists, in particular occupational and environmental epidemiologists, often study issues having significant economic, social and health policy implications. Both negative and positive results concerning the association between specific chemical exposures and disease can affect the lives of thousands of people, influence economic decisions and therefore seriously condition political choices. Thus, the epidemiologist may be under pressure, and be tempted or even encouraged by others to alter—marginally or substantially—the interpretation of the results of his or her investigations.
Among the several relevant issues, transparency of data collection, coding, computerization and analysis is central as a defence against allegations of bias on the part of the researcher. Also crucial, and potentially in conflict with such transparency, is the right of the subjects enrolled in epidemiological research to be protected from the release of personal information
(confidentiality issues).
From the point of view of misconduct that can arise especially in the context of causal inference, questions that should be addressed by ethics guidelines are:
- Who owns the data and for how long must the data be retained?
- What constitutes a credible record of the work having been done?
- Do public grants allow in the budget for costs associated with adequate documentation, archiving and re-analysis of data?
- Is there a role for the primary investigator in any third party’s re-analysis of his or her data?
- Are there standards of practice for data storage?
- Should occupational and environmental epidemiologists be establishing a normative climate in which ready data scrutiny or audit can be accomplished?
- How do good data storage practices serve to prevent not only misconduct, but also allegations of misconduct?
- What constitutes misconduct in occupational and environmental epidemiology in relation to data management, interpretation of results and advocacy?
- What is the role of the epidemiologist and/or of professional bodies in developing standards of practice and indicators/ outcomes for their assessment, and contributing expertise in any advocacy role?
- What role does the professional body/ organization have in dealing with concerns about ethics and law? (Soskolne 1993)
Other crucial issues, in the case of occupational and environmental epidemiology, relate to the involvement of the workers in preliminary phases of studies, and to the release of the results of a study to the subjects who have been enrolled and are directly affected (Schulte 1989). Unfortunately, it is not common practice that workers enrolled in epidemiological studies are involved in collaborative discussions about the purposes of the study, its interpretation and the potential uses of the findings (which may be both advantageous and detrimental to the worker).
Partial answers to these questions have been provided by recent guidelines (Beauchamp et al. 1991; CIOMS 1991). However, in each country, professional associations of occupational epidemiologists should engage in a thorough discussion about ethical issues and, possibly, adopt a set of ethics guidelines appropriate to the local context while recognizing internationally accepted normative standards of practice.
Case Studies Illustrating Methodological Issues in the Surveillance of Occupational Diseases
The documentation of occupational diseases in a country like Taiwan is a challenge to an occupational physician. For lack of a system including material safety data sheets (MSDS), workers were usually not aware of the chemicals with which they work. Since many occupational diseases have long latencies and do not show any specific symptoms and signs until clinically evident, recognition and identification of the occupational origin are often very difficult.
To better control occupational diseases, we have accessed databases which provide a relatively complete list of industrial chemicals and a set of specific signs and/or symptoms. Combined with the epidemiological approach of conjectures and refutations (i.e., considering and ruling out all possible alternative explanations), we have documented more than ten kinds of occupational diseases and an outbreak of botulism. We recommend that a similar approach be applied to any other country in a similar situation, and that a system involving an identification sheet (e.g., MSDS) for each chemical be advocated and implemented as one means to enable prompt recognition and hence the prevention of occupational diseases.
Hepatitis in a Colour Printing Factory
Three workers from a colour printing factory were admitted to community hospitals in 1985 with manifestations of acute hepatitis. One of the three had superimposed acute renal failure. Since viral hepatitis has a high prevalence in Taiwan, we should consider a viral origin among the most likely aetiologies. Alcohol and drug use, as well as organic solvents in the workplace, should also be included. Because there was no system of MSDS in Taiwan, neither the employees nor the employer were aware of all the chemicals used in the factory (Wang 1991).
We had to compile a list of hepatotoxic and nephrotoxic agents from several toxicological databases. Then, we deduced all possible inferences from the above hypotheses. For example, if hepatitis A virus (HAV) were the aetiology, we should observe antibodies (HAV-IgM) among the affected workers; if hepatitis B virus were the aetiology, we should observe more hepatitis B surface antigens (HBsAg) carriers among the affected workers as compared with non-affected workers; if alcohol were the main aetiology, we should observe more alcohol abusers or chronic alcoholics among affected workers; if any toxic solvent (e.g., chloroform) were the aetiology, we should find it at the workplace.
We performed a comprehensive medical evaluation for each worker. The viral aetiology was easily refuted, as well as the alcohol hypothesis, because they could not be supported by the evidence.
Instead, 17 of 25 workers from the plant had abnormal liver function tests, and a significant association was found between the presence of abnormal liver function and a history of recently having worked inside any of three rooms in which an interconnecting air-conditioning system had been installed to cool the printing machines. The association remained after stratification by the carrier status of hepatitis B. It was later determined that the incident occurred following inadvertent use of a “cleaning agent” (which was carbon tetrachloride) to clean a pump in the printing machine. Moreover, a simulation test of the pump-cleaning operation revealed ambient air levels of carbon tetrachloride of 115 to 495 ppm, which could produce hepatic damage. In a further refutational attempt, by eliminating the carbon tetrachloride in the workplace, we found that no more new cases occurred, and all affected workers improved after removal from the workplace for 20 days. Therefore, we concluded that the outbreak was from the use of carbon tetrachloride.
Neurological Symptoms in a Colour Printing Factory
In September 1986, an apprentice in a colour printing factory in Chang-Hwa suddenly developed acute bilateral weakness and respiratory paralysis. The victim’s father alleged on the telephone that there were several other workers with similar symptoms. Since colour printing shops were once documented to have occupational diseases resulting from organic solvent exposures, we went to the worksite to determine the aetiology with an hypothesis of possible solvent intoxication in mind (Wang 1991).
Our common practice, however, was to consider all alternative conjectures, including other medical problems including the impaired function of upper motor neurones, lower motor neurones, as well as the neuromuscular junction. Again, we deduced outcome statements from the above hypotheses. For example, if any solvent reported to produce polyneuropathy (e.g., n-hexane, methyl butylketone, acrylamide) were the cause, it would also impair the nerve conduction velocity (NCV); if it were other medical problems involving upper motor neurones, there would be signs of impaired consciousness and/or involuntary movement.
Field observations disclosed that all affected workers had a clear consciousness throughout the clinical course. An NCV study of three affected workers showed intact lower motor neurones. There was no involuntary movement, no history of medication or bites prior to the appearance of symptoms, and the neostigmine test was negative. A significant association between illness and eating breakfast in the factory cafeteria on September 26 or 27 was found; seven of seven affected workers versus seven of 32 unaffected workers ate breakfast in the factory on these two days. A further testing effort showed that type A botulinum toxin was detected in canned peanuts manufactured by an unlicensed company, and its specimen also showed a full growth of Clostridium botulinum. A final refutational trial was the removal of such products from the commercial market, which resulted in no new cases. This investigation documented the first cases of botulism from a commercial food product in Taiwan.
Premalignant Skin Lesions among Paraquat Manufacturers
In June 1983, two workers from a paraquat manufacturing factory visited a dermatology clinic complaining of numerous bilateral hyperpigmented macules with hyperkeratotic changes on parts of their hands, neck and face exposed to the sun. Some skin specimens also showed Bowenoid changes. Since malignant and premalignant skin lesions were reported among bipyridyl manufacturing workers, an occupational cause was strongly suspected. However, we also had to consider other alternative causes (or hypotheses) of skin cancer such as exposure to ionizing radiation, coal tar, pitch, soot or any other polyaromatic hydrocarbons (PAH). To rule out all of these conjectures, we conducted a study in 1985, visiting all of the 28 factories which ever engaged in paraquat manufacturing or packaging and examining the manufacturing processes as well as the workers (Wang et al. 1987; Wang 1993).
We examined 228 workers and none of them had ever been exposed to the aforementioned skin carcinogens except sunlight and 4’-4’-bipyridine and its isomers. After excluding workers with multiple exposures, we found that one out of seven administrators and two out of 82 paraquat packaging workers developed hyperpigmented skin lesions, as compared with three out of three workers involved in only bipyridine crystallization and centrifugation. Moreover, all 17 workers with hyperkeratotic or Bowen’s lesions had a history of direct exposure to bipyridyl and its isomers. The longer the exposure to bipyridyls, the more likely the development of skin lesions, and this trend cannot be explained by sunlight or age as demonstrated by stratification and logistic regression analysis. Hence, the skin lesion was tentatively attributed to a combination of bipyridyl exposures and sunlight. We made further refutational attempts to follow up if any new case occurred after enclosing all processes involving bipyridyls exposure. No new case was found.
Discussion and Conclusions
The above three examples have illustrated the importance of adopting a refutational approach and a database of occupational diseases. The former makes us always consider alternative hypotheses in the same manner as the initial intuitional hypothesis, while the latter provides a detailed list of chemical agents which can guide us toward the true aetiology. One possible limitation of this approach is that we can consider only those alternative explanations which we can imagine. If our list of alternatives is incomplete, we may be left with no answer or a wrong answer. Therefore, a comprehensive database of occupational disease is crucial to the success of this strategy.
We used to construct our own database in a laborious manner. However, the recently published OSH-ROM databases, which contain the NIOSHTIC database of more than 160,000 abstracts, may be one of the most comprehensive for such a purpose, as discussed elsewhere in the Encyclopaedia. Furthermore, if a new occupational disease occurs, we might search such a database and rule out all known aetiological agents, and leave none unrefuted. In such a situation, we may try to identify or define the new agent (or occupational setting) as specifically as possible so that the problem can first be mitigated, and then test further hypotheses. The case of premalignant skin lesions among paraquat manufacturers is a good example of this kind.
Questionnaires in Epidemiological Research
Role of Questionnaires in Epidemiological Research
Epidemiological research is generally carried out in order to answer a specific research question which relates the exposures of individuals to hazardous substances or situations with subsequent health outcomes, such as cancer or death. At the heart of nearly every such investigation is a questionnaire which constitutes the basic data-gathering tool. Even when physical measurements are to be made in a workplace environment, and especially when biological materials such as serum are to be collected from exposed or unexposed study subjects, a questionnaire is essential in order to develop an adequate exposure picture by systematically collecting personal and other characteristics in an organized and uniform way.
The questionnaire serves a number of critical research functions:
- It provides data on individuals which may not be available from any other source, including workplace records or environmental measurements.
- It permits targeted studies of specific workplace problems.
- It provides baseline information against which future health effects can be assessed.
- It provides information about participant characteristics that are necessary for proper analysis and interpretation of exposure-outcome relationships, especially possibly confounding variables like age and education, and other lifestyle variables that may affect disease risk, like smoking and diet.
Place of questionnaire design within overall study goals
While the questionnaire is often the most visible part of an epidemiological study, particularly to the workers or other study participants, it is only a tool and indeed is often called an “instrument” by researchers. Figure 1 depicts in a very general way the stages of survey design from conception through data collection and analysis. The figure shows four levels or tiers of study operation which proceed in parallel throughout the life of the study: sampling, questionnaire, operations, and analysis. The figure demonstrates quite clearly the way in which stages of questionnaire development are related to the overall study plan, proceeding from an initial outline to a first draft of both the questionnaire and its associated codes, followed by pretesting within a selected subpopulation, one or more revisions dictated by pretest experiences, and preparation of the final document for actual data collection in the field. What is most important is the context: each stage of questionnaire development is carried out in conjunction with a corresponding stage of creation and refinement of the overall sampling plan, as well as the operational design for administration of the questionnaire.
Figure 1. The stages of a survey

Types of studies and questionnaires
The research goals of the study itself determine the structure, length and content of the questionnaire. These questionnaire attributes are invariably tempered by the method of data collection, which usually falls within one of three modes: in person, mail and telephone. Each of these has its advantages and disadvantages which can affect not only the quality of the data but the validity of the overall study.
A mailed questionnaire is the least expensive format and can cover workers in a wide geographical area. However, in that overall response rates are often low (typically 45 to 75%), it cannot be overly complex since there is little or no opportunity for clarification of questions, and it may be difficult to ascertain whether potential responses to critical exposure or other questions differ systematically between respondents and non-respondents. The physical layout and language must accommodate the least educated of potential study participants, and must be capable of completion in a fairly short time period, typically 20 to 30 minutes.
Telephone questionnaires can be used in population-based studies—that is, surveys in which a sample of a geographically defined population is canvassed—and are a practical method to update information in existing data files. They may be longer and more complex than mailed questionnaires in language and content, and since they are administered by trained interviewers the greater cost of a telephone survey can be partially offset by physically structuring the questionnaire for efficient administration (such as through skip patterns). Response rates are usually better than with mailed questionnaires, but are subject to biases related to increasing use of telephone answering machines, refusals, non-contacts and problems of populations with limited telephone service. Such biases generally relate to the sampling design itself and not especially to the questionnaire. Although telephone questionnaires have long been in use in North America, their feasibility in other parts of the world has yet to be established.
Face-to-face interviews provide the greatest opportunity for collecting accurate complex data; they are also the most expensive to administer, since they require both training and travel for professional staff. The physical layout and order of questions may be arranged to optimize administration time. Studies which utilize in-person interviewing generally have the highest response rates and are subject to the least response bias. This is also the type of interview in which the interviewer is most likely to learn whether or not the participant is a case (in a case-control study) or the participant’s exposure status (in a cohort study). Care must therefore be taken to preserve the objectivity of the interviewer by training him or her to avoid leading questions and body language that might evoke biased responses.
It is becoming more common to use a hybrid study design in which complex exposure situations are assessed in a personal or telephone interview which allows maximum probing and clarification, followed by a mailed questionnaire to capture lifestyle data like smoking and diet.
Confidentiality and research participant issues
Since the purpose of a questionnaire is to obtain data about individuals, questionnaire design must be guided by established standards for ethical treatment of human subjects. These guidelines apply to acquisition of questionnaire data just as they do for biological samples such as blood and urine, or to genetic testing. In the United States and many other countries, no studies involving humans may be conducted with public funds unless approval of questionnaire language and content is first obtained from an appropriate Institutional Review Board. Such approval is intended to assure that questions are confined to legitimate study purposes, and that they do not violate the rights of study participants to answer questions voluntarily. Participants must be assured that their participation in the study is entirely voluntary, and that refusal to answer questions or even to participate at all will not subject them to any penalties or alter their relationship with their employer or medical practitioner.
Participants must also be assured that the information they provide will be held in strict confidence by the investigator, who must of course take steps to maintain the physical security and inviolability of the data. This often entails physical separation of information regarding the identity of participants from computerized data files. It is common practice to advise study participants that their replies to questionnaire items will be used only in aggregation with responses of other participants in statistical reports, and will not be disclosed to the employer, physician or other parties.
Measurement aspects of questionnaire design
One of the most important functions of a questionnaire is to obtain data about some aspect or attribute of a person in either qualitative or quantitative form. Some items may be as simple as weight, height or age, while others may be considerably more complicated, as with an individual’s response to stress. Qualitative responses, such as gender, will ordinarily be converted into numerical variables. All such measures may be characterized by their validity and their reliability. Validity is the degree to which a questionnaire-derived number approaches its true, but possibly unknown, value. Reliability measures the likelihood that a given measurement will yield the same result on repetition, whether that result is close to the “truth” or not. Figure 2 shows how these concepts are related. It demonstrates that a measurement can be valid but not reliable, reliable but not valid, or both valid and reliable.
Figure 2. Validity & reliability relationship

Over the years, many questionnaires have been developed by researchers in order to answer research questions of wide interest. Examples include the Scholastic Aptitude Test, which measures a student’s potential for future academic achievement, and the Minnesota Multiphasic Personality Inventory (MMPI), which measures certain psychosocial characteristics. A variety of other psychological indicators are discussed in the chapter on psychometrics. There are also established physiological scales, such as the British Medical Research Council (BMRC) questionnaire for pulmonary function. These instruments have a number of important advantages. Chief among these are the facts that they have already been developed and tested, usually in many populations, and that their reliability and validity are known. Anyone constructing a questionnaire is well advised to utilize such scales if they fit the study purpose. Not only do they save the effort of “re-inventing the wheel”, but they make it more likely that study results will be accepted as valid by the research community. It also makes for more valid comparisons of results from different studies provided they have been properly used.
The preceding scales are examples of two important types of measures which are commonly used in questionnaires to quantify concepts that may not be fully objectively measurable in the way that height and weight are, or which require many similar questions to fully “tap the domain” of one specific behavioural pattern. More generally, indexes and scales are two data reduction techniques that provide a numerical summary of groups of questions. The above examples illustrate physiological and psychological indexes, and they are also frequently used to measure knowledge, attitude and behaviour. Briefly, an index is usually constructed as a score obtained by counting, among a group of related questions, the number of items that apply to a study participant. For instance, if a questionnaire presents a list of diseases, a disease history index could be the total number of those which a respondent says he or she has had. A scale is a composite measure based on the intensity with which a participant answers one or more related questions. For example, the Likert scale, which is frequently used in social research, is typically constructed from statements with which one may agree strongly, agree weakly, offer no opinion, disagree weakly, or disagree strongly, the response being scored as a number from 1 to 5. Scales and indexes may be summed or otherwise combined to form a fairly complex picture of study participants’ physical, psychological, social or behavioural characteristics.
Validity merits special consideration because of its reflection of the “truth”. Three important types of validity often discussed are face, content and criterion validity. Face validity is a subjective quality of an indicator which insures that the wording of a question is clear and unambiguous. Content validity insures that the questions will serve to tap that dimension of response in which the researcher is interested. Criterion (or predictive) validity is derived from an objective assessment of how closely a questionnaire measurement approaches a separately measurable quantity, as for instance how well a questionnaire assessment of dietary vitamin A intake matches the actual consumption of vitamin A, based upon food consumption as documented with dietary records.
Questionnaire content, quality and length
Wording. The wording of questions is both an art and a professional skill. Therefore, only the most general of guidelines can be presented. It is generally agreed that questions should be devised which:
- motivate the participant to respond
- draw upon the participant’s personal knowledge
- take into account his or her limitations and personal frame of reference, so that the aim and meaning of the questions is easily understood and
- elicit a response based upon the participant’s own knowledge and do not require guessing, except possibly for attitude and opinion questions.
Question sequence and structure. Both the order and presentation of questions can affect the quality of information gathered. A typical questionnaire, whether self-administered or read by an interviewer, contains a prologue which introduces the study and its topic to the respondent, provides any additional information he or she will need, and tries to motivate the respondent to answer the questions. Most questionnaires contain a section designed to collect demographic information, such as age, gender, ethnic background and other variables about the participant’s background, including possibly confounding variables. The main subject matter of data collection, such as nature of the workplace and exposure to specific substances, is usually a distinct questionnaire section, and is often preceded by an introductory prologue of its own which might first remind the participant of specific aspects of the job or workplace in order to create a context for detailed questions. The layout of questions that are intended to establish worklife chronologies should be arranged so as to minimize the risk of chronological omissions. Finally, it is customary to thank the respondent for his or her participation.
Types of questions. The designer must decide whether to use open-ended questions in which participants compose their own answers, or closed questions that require a definite response or a choice from a short menu of possible responses. Closed questions have the advantage that they clarify alternatives for the respondent, avoid snap responses, and minimize lengthy rambling that may be impossible to interpret. However, they require that the designer anticipate the range of potential responses in order to avoid losing information, particularly for unexpected situations that occur in many workplaces. This in turn requires well planned pilot testing. The investigator must decide whether and to what extent to permit a “don’t know” response category.
Length. Determining the final length of a questionnaire requires striking a balance between the desire to obtain as much detailed information as possible to achieve the study goals with the fact that if a questionnaire is too lengthy, at some point many respondents will lose interest and either stop responding or respond hastily, inaccurately and without thought in order to bring the session to an end. On the other hand, a questionnaire which is very short may obtain a high response rate but not achieve the study goals. Since respondent motivation often depends on having a personal stake in the outcome, such as improving working conditions, tolerance for a lengthy questionnaire may vary widely, especially when some participants (such as workers in a particular plant) may perceive their stake to be higher than others (such as persons contacted via random telephone dialling). This balance can be achieved only through pilot testing and experience. Interviewer-administered questionnaires should record the beginning and ending time to permit calculation of the duration of the interview. This information is useful in assessing the level of quality of the data.
Language. It is essential to use the language of the population to make the questions understood by all. This may require becoming familiar with local vernacular that may vary within any one country. Even in countries where the same language is nominally spoken, such as Britain and the United States, or the Spanish-speaking countries of Latin America, local idioms and usage may vary in a way that can obscure interpretation. For example, in the US “tea” is merely a beverage, whereas in Britain it may mean “a pot of tea,” “high tea,” or “the main evening meal,” depending on locale and context. It is especially important to avoid scientific jargon, except where study participants can be expected to possess specific technical knowledge.
Clarity and leading questions. While it is often the case that shorter questions are clearer, there are exceptions, especially where a complex subject needs to be introduced. Nevertheless, short questions clarify thinking and reduce unnecessary words. They also reduce the chance of overloading the respondent with too much information to digest. If the purpose of the study is to obtain objective information about the participant’s working situation, it is important to word questions in a neutral way and to avoid “leading” questions that may favour a particular answer, such as “Do you agree that your workplace conditions are harmful to your health?”
Questionnaire layout. The physical layout of a questionnaire can affect the cost and efficiency of a study. It is more important for self-administered questionnaires than those which are conducted by interviewers. A questionnaire which is designed to be completed by the respondent but which is overly complex or difficult to read may be filled out casually or even discarded. Even questionnaires which are designed to be read aloud by trained interviewers need to be printed in clear, readable type, and patterns of question skipping must be indicated in a manner which maintains a steady flow of questioning and minimizes page turning and searching for the next applicable question.
Validity Concerns
Bias
The enemy of objective data gathering is bias, which results from systematic but unplanned differences between groups of people: cases and controls in a case-control study or exposed and non-exposed in a cohort study. Information bias may be introduced when two groups of participants understand or respond differently to the same question. This may occur, for instance, if questions are posed in such a way as to require special technical knowledge of a workplace or its exposures that would be understood by exposed workers but not necessarily by the general public from which controls are drawn.
The use of surrogates for ill or deceased workers has the potential for bias because next-of-kin are likely to recall information in different ways and with less accuracy than the worker himself or herself. The introduction of such bias is especially likely in studies in which some interviews are carried out directly with study participants while other interviews are carried out with relatives or co-workers of other research participants. In either situation, care must be taken to reduce any effect that might arise from the interviewer’s knowledge of the disease or exposure status of the worker of interest. Since it is not always possible to keep interviewers “blind,” it is important to emphasize objectivity and avoidance of leading or suggestive questions or unconscious body language during training, and to monitor performance while the study is being carried out.
Recall bias results when cases and controls “remember” exposures or work situations differently. Hospitalized cases with a potential occupationally related illness may be more capable of recalling details of their medical history or occupational exposures than persons contacted randomly on the telephone. A type of this bias that is becoming more common has been labelled social desirability bias. It describes the tendency of many people to understate, whether consciously or not, their indulgence in “bad habits” such as cigarette smoking or consumption of foods high in fat and cholesterol, and to overstate “good habits” like exercise.
Response bias denotes a situation in which one group of study participants, such as workers with a particular occupational exposure, may be more likely to complete questionnaires or otherwise participate in a study than unexposed persons. Such a situation may result in a biased estimation of the association between exposure and disease. Response bias may be suspected if response rates or the time taken to complete a questionnaire or interview differ substantially between groups (e.g., cases vs. controls, exposed vs. unexposed). Response bias generally differs depending upon the mode of questionnaire administration. Questionnaires which are mailed are usually more likely to be returned by individuals who see a personal stake in study findings, and are more likely to be ignored or discarded by persons selected at random from the general population. Many investigators who utilize mail surveys also build in a follow-up mechanism which may include second and third mailings as well as subsequent telephone contacts with non-respondents in order to maximize response rates.
Studies which utilize telephone surveys, including those which make use of random digit dialling to identify controls, usually have a set of rules or a protocol defining how many times attempts to contact potential respondents must be made, including time of day, and whether evening or weekend calls should be attempted. Those who conduct hospital-based studies usually record the number of patients who refuse to participate, and reasons for non-participation. In all such cases, various measures of response rates are recorded in order to provide an assessment of the extent to which the target population has actually been reached.
Selection bias results when one group of participants preferentially responds or otherwise participates in a study, and can result in biased estimation of the relationship between exposure and disease. In order to assess selection bias and whether it leads to under- or over-estimation of exposure, demographic information such as educational level can be used to compare respondents with non-respondents. For example, if participants with little education have lower response rates than participants with higher education, and if a particular occupation or smoking habit is known to be more frequent in less educated groups, then selection bias with underestimation of exposure for that occupation or smoking category is likely to have occurred.
Confounding is an important type of selection bias which results when the selection of respondents (cases and controls in a case-control study, or exposed and unexposed in a cohort study) depends in some way upon a third variable, sometimes in a manner unknown to the investigator. If not identified and controlled, it can lead unpredictably to underestimates or overestimates of disease risks associated with occupational exposures. Confounding is usually dealt with either by manipulating the design of the study itself (e.g., through matching cases to controls on age and other variables) or at the analysis stage. Details of these techniques are presented in other articles within this chapter.
Documentation
In any research study, all study procedures must be thoroughly documented so that all staff, including interviewers, supervisory personnel and researchers, are clear about their respective duties. In most questionnaire-based studies, a coding manual is prepared which describes on a question-by-question basis everything the interviewer needs to know beyond the literal wording of the questions. This includes instructions for coding categorical responses and may contain explicit instructions on probing, listing those questions for which it is permitted and those for which it is not. In many studies new, unforeseen response choices for certain questions are occasionally encountered in the field; these must be recorded in the master codebook and copies of additions, changes or new instructions distributed to all interviewers in a timely fashion.
Planning, testing and revision
As can be seen from figure 1, questionnaire development requires a great deal of thoughtful planning. Every questionnaire needs to be tested at several stages in order to make certain that the questions “work”, i.e., that they are understandable and produce responses of the intended quality. It is useful to test new questions on volunteers and then to interrogate them at length to determine how well specific questions were understood and what types of problems or ambiguities were encountered. The results can then be utilized to revise the questionnaire, and the procedure can be repeated if necessary. The volunteers are sometimes referred to as a “focus group”.
All epidemiological studies require pilot testing, not only for the questionnaires, but for the study procedures as well. A well designed questionnaire serves its purpose only if it can be delivered efficiently to the study participants, and this can be determined only by testing procedures in the field and making adjustments when necessary.
Interviewer training and supervision
In studies which are conducted by telephone or face-to-face interview, the interviewer plays a critical role. This person is responsible not simply for presenting questions to the study participants and recording their responses, but also for interpreting those responses. Even with the most rigidly structured interview study, respondents occasionally request clarification of questions, or offer responses which do not fit the available response categories. In such cases the interviewer’s job is to interpret either the question or the response in a manner consistent with the intent of the researcher. To do so effectively and consistently requires training and supervision by an experienced researcher or manager. When more than one interviewer is employed on a study, interviewer training is especially important to insure that questions are presented and responses interpreted in a uniform manner. In many research projects this is accomplished in group training settings, and is repeated periodically (e.g., annually) in order to keep the interviewers’ skills fresh. Training seminars commonly cover the following topics in considerable detail:
- general introduction to the study
- informed consent and confidentiality issues
- how to introduce the interview and how to interact with respondents
- the intended meaning of each question
- instructions for probing, i.e., offering the respondent further opportunity to clarify or embellish responses
- discussion of typical problems which arise during interviews.
Study supervision often entails onsite observation, which may include tape-recording of interviews for subsequent dissection. It is common practice for the supervisor to personally review every questionnaire prior to approving and submitting it to data entry. The supervisor also sets and enforces performance standards for interviewers and in some studies conducts independent re-interviews with selected participants as a reliability check.
Data collection
The actual distribution of questionnaires to study participants and subsequent collection for analysis is carried out using one of the three modes described above: by mail, telephone or in person. Some researchers organize and even perform this function themselves within their own institutions. While there is considerable merit to a senior investigator becoming familiar with the dynamics of the interview at first hand, it is most cost effective and conducive to maintaining high data quality for trained and well-supervised professional interviewers to be included as part of the research team.
Some researchers make contractual arrangements with companies that specialize in survey research. Contractors can provide a range of services which may include one or more of the following tasks: distributing and collecting questionnaires, carrying out telephone or face-to-face interviews, obtaining biological specimens such as blood or urine, data management, and statistical analysis and report writing. Irrespective of the level of support, contractors are usually responsible for providing information about response rates and data quality. Nevertheless, it is the researcher who bears final responsibility for the scientific integrity of the study.
Reliability and re-interviews
Data quality may be assessed by re-interviewing a sample of the original study participants. This provides a means for determining the reliability of the initial interviews, and an estimate of the repeatability of responses. The entire questionnaire need not be re-administered; a subset of questions usually is sufficient. Statistical tests are available for assessing the reliability of a set of questions asked of the same participant at different times, as well as for assessing the reliability of responses provided by different participants and even for those queried by different interviewers (i.e., inter- and intra-rater assessments).
Technology of questionnaire processing
Advances in computer technology have created many different ways in which questionnaire data can be captured and made available to the researcher for computer analysis. There are three fundamentally different ways in which data can be computerized: in real time (i.e., as the participant responds during an interview), by traditional key entry methods, and by optical data capture methods.
Computer-aided data capture
Many researchers now use computers to collect responses to questions posed in both face-to-face and telephone interviews. Researchers in the field find it convenient to use laptop computers which have been programmed to display the questions sequentially and which permit the interviewer to enter the response immediately. Survey research companies which do telephone interviewing have developed analogous systems called computer-aided telephone interview (CATI) systems. These methods have two important advantages over more traditional paper questionnaires. First, responses can be instantly checked against a range of permissible answers and for consistency with previous responses, and discrepancies can be immediately brought to the attention of both the interviewer and the respondent. This greatly reduces the error rate. Secondly, skip patterns can be programmed to minimize administration time.
The most common method for computerizing data still is the traditional key entry by a trained operator. For very large studies, questionnaires are usually sent to a professional contract company which specializes in data capture. These firms often utilize specialized equipment which permits one operator to key a questionnaire (a procedure sometimes called keypunch for historical reasons) and a second operator to re-key the same data, a process called key verification. Results of the second keying are compared with the first to assure the data have been entered correctly. Quality assurance procedures can be programmed which ensure that each response falls within an allowable range, and that it is consistent with other responses. The resulting data files can be transmitted to the researcher on disk, tape or electronically by telephone or other computer network.
For smaller studies, there are numerous commercial PC-based programs which have data entry features which emulate those of more specialized systems. These include database programs such as dBase, Foxpro and Microsoft Access, as well as spreadsheets such as Microsoft Excel and Lotus 1-2-3. In addition, data entry features are included with many computer program packages whose principal purpose is statistical data analysis, such as SPSS, BMDP and EPI INFO.
One widespread method of data capture which works well for certain specialized questionnaires uses optical systems. Optical mark reading or optical sensing is used to read responses on questionnaires that are specially designed for participants to enter data by marking small rectangles or circles (sometimes called “bubble codes”). These work most efficiently when each individual completes his or her own questionnaire. More sophisticated and expensive equipment can read hand-printed characters, but at present this is not an efficient technique for capturing data in large-scale studies.
Archiving Questionnaires and Coding Manuals
Because information is a valuable resource and is subject to interpretation and other influences, researchers sometimes are asked to share their data with other researchers. The request to share data can be motivated by a variety of reasons, which may range from a sincere interest in replicating a report to concern that data may not have been analysed or interpreted correctly.
Where falsification or fabrication of data is suspected or alleged, it becomes essential that the original records upon which reported findings are based be available for audit purposes. In addition to the original questionnaires and/or computer files of raw data, the researcher must be able to provide for review the coding manual(s) developed for the study and the log(s) of all data changes which were made in the course of data coding, computerization and analysis. For example, if a data value had been altered because it had initially appeared as an outlier, then a record of the change and the reasons for making the change should have been recorded in the log for possible data audit purposes. Such information also is of value at the time of report preparation because it serves as a reminder about how the data which gave rise to the reported findings had actually been handled.
For these reasons, upon completion of a study, the researcher has an obligation to ensure that all basic data are appropriately archived for a reasonable period of time, and that they could be retrieved if the researcher were called upon to provide them.
Asbestos: Historical Perspective
Several examples of workplace hazards often are quoted to exemplify not only the possible adverse health effects associated with workplace exposures, but also to reveal how a systematic approach to the study of worker populations can uncover important exposure-disease relationships. One such example is that of asbestos. The simple elegance with which the late Dr. Irving J. Selikoff demonstrated the elevated cancer risk among asbestos workers has been documented in an article by Lawrence Garfinkel. It is reprinted here with only slight modification and with the permission of CA-A Cancer Journal for Clinicians (Garfinkel 1984). The tables came from the original article by Dr. Selikoff and co-workers (1964).
Asbestos exposure has become a public health problem of considerable magnitude, with ramifications that extend beyond the immediate field of health professionals to areas served by legislators, judges, lawyers, educators, and other concerned community leaders. As a result, asbestos-related diseases are of increasing concern to clinicians and health authorities, as well as to consumers and the public at large.
Historical Background
Asbestos is a highly useful mineral that has been utilized in diverse ways for many centuries. Archaeological studies in Finland have shown evidence of asbestos fibres incorporated in pottery as far back as 2500 BC. In the 5th century BC, it was used as a wick for lamps. Herodotus commented on the use of asbestos cloth for cremation about 456 BC. Asbestos was used in body armour in the 15th century, and in the manufacture of textiles, gloves, socksand handbags in Russia c. 1720. Although it is uncertain when the art of weaving asbestos was developed, we know that the ancients often wove asbestos with linen. Commercial asbestos production began in Italy about 1850, in the making of paper and cloth.
The development of asbestos mining in Canada and South Africa about 1880 reduced costs and spurred the manufacture of asbestos products. Mining and production of asbestos in the United States, Italy and Russia followed soon after. In the United States, the development of asbestos as pipe insulation increased production and was followed shortly thereafter by other varied uses including brake linings, cement pipes, protective clothing and so forth.
Production in the US increased from about 6,000 tons in 1900 to 650,000 tons in 1975, although by 1982, it was about 300,000 tons and by 1994, production had dropped to 33,000 tons.
It is reported that Pliny the Younger (61-113 AD) commented on the sickness of slaves who worked with asbestos. Reference to occupational disease associated with mining appeared in the 16th century, but it was not until 1906 in England that the first reference to pulmonary fibrosis in an asbestos worker appeared. Excess deaths in workers involved with asbestos manufacturing applications were reported shortly thereafter in France and Italy, but major recognition of asbestos-induced disease began in England in 1924. By 1930, Wood and Gloyne had reported on 37 cases of pulmonary fibrosis.
The first reference to carcinoma of the lung in a patient with “asbestos-silicosis” appeared in 1935. Several other case reports followed. Reports of high percentages of lung cancer in patients who died of asbestosis appeared in 1947, 1949 and 1951. In 1955 Richard Doll in England reported an excess risk of lung cancer in persons who had worked in an asbestos plant since 1935, with an especially high risk in those who were employed more than 20 years.
Clinical Observations
It was against this background that Dr. Irving Selikoff’s clinical observations of asbestos-related disease began. Dr. Selikoff was at that time already a distinguished scientist. His prior accomplishments included the development and first use of isoniazid in the treatment of tuberculosis, for which he received a Lasker Award in 1952.
In the early 1960s, as a chest physician practising in Paterson, New Jersey, he had observed many cases of lung cancer among workers in an asbestos factory in the area. He decided to extend his observations to include two locals of the asbestos insulator workers union, whose members also had been exposed to asbestos fibres. He recognized that there were still many people who did not believe that lung cancer was related to asbestos exposure and that only a thorough study of a total exposed population could convince them. There was the possibility that asbestos exposure in the population could be related to other types of cancer, such as pleural and peritoneal mesothelioma, as had been suggested in some studies, and perhaps other sites as well. Most of the studies of the health effects of asbestos in the past had been concerned with workers exposed in the mining and production of asbestos. It was important to know if asbestos inhalation also affected other asbestos-exposed groups.
Dr. Selikoff had heard of the accomplishments of Dr. E. Cuyler Hammond, then Director of the Statistical Research Section of the American Cancer Society (ACS), and decided to ask him to collaborate in the design and analysis of a study. It was Dr. Hammond who had written the landmark prospective study on smoking and health published a few years earlier.
Dr. Hammond immediately saw the potential importance of a study of asbestos workers. Although he was busily engaged in analysing data from the then new ACS prospective study, Cancer Prevention Study I (CPS I), which he had begun a few years earlier, he readily agreed to a collaboration in his “spare time”. He suggested confining the analysis to those workers with at least 20 years’ work experience, who thus would have had the greatest amount of asbestos exposure.
The team was joined by Mrs. Janet Kaffenburgh, a research associate of Dr. Selikoff’s at Mount Sinai Hospital, who worked with Dr. Hammond in preparing the lists of the men in the study, including their ages and dates of employment and obtaining the data on facts of death and causes from union headquarters records. This information was subsequently transferred to file cards that were sorted literally on the living room floor of Dr. Hammond’s house by Dr. Hammond and Mrs. Kaffenburgh.
Dr. Jacob Churg, a pathologist at Barnert Memorial Hospital Center in Paterson, New Jersey, provided pathologic verification of the cause of death.
Tabe 1. Man-years of experience of 632 asbestos workers exposed to asbestos dust 20 years or longer
|
Age |
Time period |
|||
|
1943-47 |
1948-52 |
1953-57 |
1958-62 |
|
|
35–39 |
85.0 |
185.0 |
7.0 |
11.0 |
|
40–44 |
230.5 |
486.5 |
291.5 |
70.0 |
|
45–49 |
339.5 |
324.0 |
530.0 |
314.5 |
|
50–54 |
391.5 |
364.0 |
308.0 |
502.5 |
|
55–59 |
382.0 |
390.0 |
316.0 |
268.5 |
|
60–64 |
221.0 |
341.5 |
344.0 |
255.0 |
|
65–69 |
139.0 |
181.0 |
286.0 |
280.0 |
|
70–74 |
83.0 |
115.5 |
137.0 |
197.5 |
|
75–79 |
31.5 |
70.0 |
70.5 |
75.0 |
|
80–84 |
5.5 |
18.5 |
38.5 |
23.5 |
|
85+ |
3.5 |
2.0 |
8.0 |
13.5 |
|
Total |
1,912.0 |
2,478.0 |
2,336.5 |
2,011.0 |
The resulting study was of the type classified as a “prospective study retrospectively carried out”. The nature of the union records made it possible to accomplish an analysis of a long-range study in a relatively short period of time. Although only 632 men were involved in the study, there were 8,737 man-years of exposure to risk (see table 1); 255 deaths occurred during the 20-year period of observation from 1943 through 1962 (see table 2). It is in table 28.17 where the observed number of deaths can be seen invariably to exceed the number expected, demonstrating the association between workplace asbestos exposure and an elevated cancer death rate.
Table 2. Observed and expected number of deaths among 632 asbestos workers exposed to asbestos dust 20 years or longer
|
Cause of death |
Time period |
Total |
|||
|
1943-47 |
1948-52 |
1953-57 |
1958-62 |
1943-62 |
|
|
Total, all causes |
|||||
|
Observed (asbestos workers) |
28.0 |
54.0 |
85.0 |
88.0 |
255.0 |
|
Expected (US White males) |
39.7 |
50.8 |
56.6 |
54.4 |
203.5 |
|
Total cancer, all sites |
|||||
|
Observed (asbestos workers) |
13.0 |
17.0 |
26.0 |
39.0 |
95.0 |
|
Expected (US White males) |
5.7 |
8.1 |
13.0 |
9.7 |
36.5 |
|
Cancer of lung and pleura |
|||||
|
Observed (asbestos workers) |
6.0 |
8.0 |
13.0 |
18.0 |
45.0 |
|
Expected (US White males) |
0.8 |
1.4 |
2.0 |
2.4 |
6.6 |
|
Cancer of stomach, colon and rectum |
|||||
|
Observed (asbestos workers) |
4.0 |
4.0 |
7.0 |
14.0 |
29.0 |
|
Expected (US White males) |
2.0 |
2.5 |
2.6 |
2.3 |
9.4 |
|
Cancer of all other sites combined |
|||||
|
Observed (asbestos workers) |
3.0 |
5.0 |
6.0 |
7.0 |
21.0 |
|
Expected (US White males) |
2.9 |
4.2 |
8.4 |
5.0 |
20.5 |
Significance of the Work
This paper constituted a turning point in our knowledge of asbestos-related disease and set the direction of future research. The article has been cited in scientific publications at least 261 times since it was originally published. With financial support from the ACS and the National Institutes of Health, Dr. Selikoff and Dr. Hammond and their growing team of mineralogists, chest physicians, radiologists, pathologists, hygienists and epidemiologists continued to explore various facets of asbestos disease.
A major paper in 1968 reported the synergistic effect of cigarette smoking on asbestos exposure (Selikoff, Hammond and Churg 1968). The studies were expanded to include asbestos production workers, persons indirectly exposed to asbestos in their work (shipyard workers, for example) and those with family exposure to asbestos.
In a later analysis, in which the team was joined by Herbert Seidman, MBA, Assistant Vice President for Epidemiology and Statistics of the American Cancer Society, the group demonstrated that even short-term exposure to asbestos resulted in a significant increased risk of cancer up to 30 years later (Seidman, Selikoff and Hammond 1979). There were only three cases of mesothelioma in this first study of 632 insulators, but later investigations showed that 8% of all deaths among asbestos workers were due to pleural and peritoneal mesothelioma.
As Dr. Selikoff’s scientific investigations expanded, he and his co-workers made noteworthy contributions toward reducing exposure to asbestos through innovations in industrial hygiene techniques; by persuading legislators about the urgency of the asbestos problem; in evaluating the problems of disability payments in connection with asbestos disease; and in investigating the general distribution of asbestos particles in water supplies and in the ambient air.
Dr. Selikoff also called the medical and scientific community’s attention to the asbestos problem by organizing conferences on the subject and participating in many scientific meetings. Many of his orientation meetings on the problem of asbestos disease were structured particularly for lawyers, judges, presidents of large corporations and insurance executives.
More...
Mental Workload
Mental Versus Physical Workload
The concept of mental workload (MWL) has become increasingly important since modern semi-automated and computerized technologies may impose severe requirements on human mental or information-processing capabilities within both manufacturing and administrative tasks. Thus, especially for the domains of job analysis, evaluation of job requirements and job design, the conceptualization of mental workload has become even more important than that of traditional physical workload.
Definitions of Mental Workload
There is no agreed-upon definition of mental workload. The main reason is that there are at least two theoretically well-based approaches and definitions: (1) MWL as viewed in terms of the task requirements as an independent, external variable with which the working subjects have to cope more or less efficiently, and (2) MWL as defined in terms of an interaction between task requirements and human capabilities or resources (Hancock and Chignell 1986; Welford 1986; Wieland-Eckelmann 1992).
Although arising from different contexts, both approaches offer necessary and well-founded contributions to different problems.
The requirements resources interaction approach was developed within the context of personality-environment fit/misfit theories which try to explain interindividually differing responses to identical physical and psychosocial conditions and requirements. Thus, this approach may explain individual differences in the patterns of subjective responses to loading requirements and conditions, for example, in terms of fatigue, monotony, affective aversion, burnout or diseases (Gopher and Donchin 1986; Hancock and Meshkati 1988).
The task requirements approach was developed within those parts of occupational psychology and ergonomics which are predominantly engaged in task design, especially in the design of new and untried future tasks, or so-called prospective task design. The background here is the stress-strain concept. Task requirements constitute the stress and the working subjects try to adapt to or to cope with the demands much as they would to other forms of stress (Hancock and Chignell 1986). This task requirements approach tries to answer the question of how to design tasks in advance in order to optimize their later impact on the—often still unknown—employees who will accomplish these future tasks.
There are at least a few common characteristics of both conceptualizations of MWL.
- MWL mainly describes the input aspects of tasks, that is to say, the requirements and demands made by the tasks on the employees, which might be used in forecasting the task outcome.
- The mental aspects of MWL are conceptualized in terms of information processing. Information processing includes cognitive as well as motivational/volitional and emotional aspects, since the persons always will evaluate the demands which they have to cope with and, thus, will self-regulate their effort for processing.
- Information-processing integrates mental processes, representations (for example, knowledge, or mental models of a machine) and states (for example, states of consciousness, degrees of activation and, less formally, mood).
- MWL is a multidimensional characteristic of task requirements, since every task varies in a couple of interrelated but nevertheless distinct dimensions which separately must be dealt with in task design.
- MWL will have a multidimensional impact which at least will determine (a) behaviour, for example, the strategies and the resulting performance, (b) perceived, subjective short-term well-being with consequences for health in the long run, and (c) psycho-physiological processes, for example, alterations of blood pressure at work, which may become long-term effects of a positive kind (promoting, say, fitness improvement) or of a negative kind (involving impairments or ill-health).
- From the point of view of task design, MWL should not be minimized—as would be necessary in the case of carcinogenic air pollution—but optimized. The reason is that demanding mental task requirements are inevitable for well-being, health promotion and qualification since they offer the necessary activating impulses, fitness prerequisites and learning/training options. Missing demands on the contrary may result in deactivation, loss of physical fitness, de-qualification and deterioration of so-called intrinsic (task content-dependent) motivation. Findings in this area led to the technique of health and personality promoting task design (Hacker 1986).
- MWL therefore, in any case, must be dealt with in task analysis, task requirement evaluation as well as in corrective and prospective task design.
Theoretical Approaches: Requirement-Resources Approaches
From the person-environment fit point of view, MWL and its consequences may be roughly categorized—as is shown in figure 1—into underload, properly fitting load, and overload. This categorization results from the relationships between task requirements and mental capabilities or resources. Task requirements may exceed, fit with or fail to be satisfied by the resources. Both types of misfit may result from quantitative or qualitative modes of misfit and will have qualitatively differing, but in any case negative, consequences (see figure 1).
Figure 1. Types and consequences of requirements-resources relationships
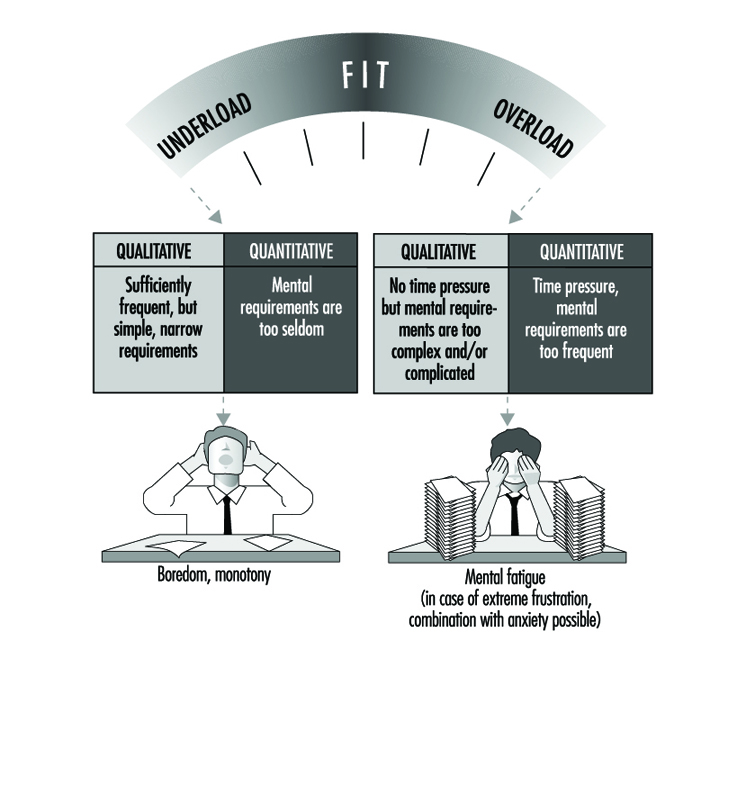
Some theories attempt to define MWL starting from the resource or capacity side of the requirements, namely, resources relationships. These resource theories might be subdivided into resource volume and resource allocation theories (Wieland-Eckelmann 1992). The amount of available capacity may come from a single source (single resource theories) which determines processing. The availability of this resource varies with arousal (Kahneman 1973). Modern multiple resource theories suppose a set of relatively independent processing resources. Thus, performance will depend on the condition whether the same resource or different resources are required simultaneously and concurrently. Different resources are, for example, encoding, processing or responding resources (Gopher and Donchin 1986; Welford 1986). The most critical problem for these types of theories is the reliable identification of one or more well-defined capacities for qualitatively different processing operations.
Resource allocation theories suppose qualitatively changing processing as a function of varying strategies. Depending on the strategies, differing mental processes and representations may be applied for task accomplishment. Thus, not the volume of stable resources but flexible allocation strategies become the key point of interest. Again, however, essential questions—especially concerning the methods of diagnosis of the strategies—remain to be answered.
Assessment of MWL: using requirement-resource approaches
A strict measurement of MWL at present would be impossible since well-defined units of measurement are lacking. But, to be sure, the conceptualization and the instruments for an assessment should meet the general quality criteria of diagnostic approaches, which have objectivity, reliability, validity and usefulness. However, as of now, only a little is known about the overall quality of proposed techniques or instruments.
There are a sizeable number of reasons for the remaining difficulties with assessing MWL according to the requirement-resource approaches (O’Donnell and Eggemeier 1986). An attempt at MWL assessment has to cope with questions like the following: is the task self-intended, following self-set goals, or is it directed with reference to an externally defined order? Which type of capacities (conscious intellectual processing, application of tacit knowledge, etc.) are required, and are they called upon simultaneously or sequentially? Are there different strategies available and, if so, which ones? Which coping mechanisms of a working person might be required?
The most often discussed approaches try to assess MWL in terms of:
- required effort (effort assessment) approaches applying—in some versions psychophysiologically validated—scaling procedures such as those offered by Bartenwerfer (1970) or Eilers, Nachreiner and Hänicke (1986), or
- occupied or, vice versa, residual mental capacity (mental capacity assessment) approaches applying the traditional dual task techniques as, for example, discussed by O’Donnell and Eggemeier (1986).
Both approaches are heavily dependent on the assumptions of single resource theories and consequently have to struggle with the above-mentioned questions.
Effort assessment. Such effort assessment techniques as, for example, the scaling procedure applied to a perceived correlate of the general central activation, developed and validated by Bartenwerfer (1970), offer verbal scales which may be completed by graphic ones and which grade the unidimensionally varying part of the perceived required effort during task accomplishment. The subjects are requested to describe their perceived effort by means of one of the steps of the scale provided.
The quality criteria mentioned above are met by this technique. Its limitations include the unidimensionality of the scale, covering an essential but questionable part of perceived effort; the limited or absent possibility of forecasting perceived personal task outcomes, for example, in terms of fatigue, boredom or anxiety; and especially the highly abstract or formal character of effort which will identify and explain nearly nothing of the content-dependent aspects of MWL as, for example, any possible useful applications of the qualification or the learning options.
Mental capacity assessment. The mental capacity assessment consists of the dual task techniques and a related data interpretation procedure, called the performance operating characteristic (POC). Dual task techniques cover several procedures. Their common feature is that subjects are requested to perform two tasks simultaneously. The crucial hypothesis is: the less an additional or secondary task in the dual task situation will deteriorate in comparison with the base-line single task situation, the lower the mental capacity requirements of the primary task, and vice versa. The approach is now broadened and various versions of task interference under dual task conditions are investigated. For example, the subjects are instructed to perform two tasks concurrently with graded variations of the priorities of the tasks. The POC curve graphically illustrates the effects of possible dual-task combinations arising from sharing limited resources among the concurrently performed tasks.
The critical assumptions of the approach mainly consist in the suggestions that every task will require a certain share of a stable, limited conscious (versus unconscious, automated, implicit or tacit) processing capacity, in the hypothetical additive relationship of the two capacity requirements, and in the restriction of the approach to performance data only. The latter might be misleading for several reasons. First of all there are substantial differences in the sensitivity of performance data and subjectively perceived data. Perceived load seems to be determined mainly by the amount of required resources, often operationalized in terms of working memory, whereas performance measures seem to be determined predominantly by the efficiency of the sharing of resources, depending on allocation strategies (this is dissociation theory; see Wickens and Yeh 1983). Moreover, individual differences in information processing abilities and personality traits strongly influence the indicators of MWL within the subjective (perceived), performance and psychophysiological areas.
Theoretical Approaches: Task Requirement Approaches
As has been shown, task requirements are multidimensional and, thus, may not be described sufficiently by means of only one dimension, whether it be the perceived effort or the residual conscious mental capacity. A more profound description might be a profile-like one, applying a theoretically selected pattern of graded dimensions of task characteristics. The central issue is thus the conceptualization of “task”, especially in terms of task content, and of “task accomplishment”, especially in terms of the structure and phases of goal-oriented actions. The role of the task is stressed by the fact that even the impact of contextual conditions (like temperature, noise or working hours) on the persons are task-dependent, since they are mediated by the task acting as a gate device (Fisher 1986). Various theoretical approaches sufficiently agree regarding those critical task dimensions, which offer a valid prediction of the task outcome. In any case, task outcome is twofold, since (1) the intended result must be achieved, meeting the performance-outcome criteria, and (2) a number of unintended personal short-term and cumulative long-term side effects will emerge, for example fatigue, boredom (monotony), occupational diseases or improved intrinsic motivation, knowledge or skills.
Assessment of MWL. With task requirement approaches, action-oriented approaches like those of complete versus partialized actions or the motivation potential score (for an elaboration of both see Hacker 1986), propose as indispensable task characteristics for analysis and evaluation at least the following:
- temporal and procedural autonomy regarding decisions on self-set goals and, consequently, transparency, predictability and control of the work situation
- number and variety of subtasks (especially concerning preparation, organization and checking of the results of implementation) and of actions accomplishing these subtasks (i.e., whether such actions involve cyclical completeness versus fragmentation)
- variety (“level”) of action-regulating mental processes and representations. These may be mentally automated or routinized ones, knowledge-based “if-then” ones or intellectual and problem-solving ones. (They may also be characterized by hierarchical completeness as opposed to fragmentation)
- required cooperation
- long-term learning requirements or options.
The identification of these task characteristics requires the joint procedures of job/task analysis, including document analyses, observations, interviews and group discussions, which must be integrated in a quasi-experimental design (Rudolph, Schönfelder and Hacker 1987). Task analysis instruments which may guide and assist the analysis are available. Some of them assist only the analysis (for example, NASA-TLX Task Load Index, Hart and Staveland, 1988) while others are useful for evaluation and design or redesign. An example here is the TBS-GA (Tätigkeitsbewertungs System für geistige Arbeit [Task Diagnosis Survey—Mental Work]); see Rudolph, Schönfelder and Hacker (1987).
Biomarkers
The word biomarker is short for biological marker, a term that refers to a measurable event occurring in a biological system, such as the human body. This event is then interpreted as a reflection, or marker, of a more general state of the organism or of life expectancy. In occupational health, a biomarker is generally used as an indicator of health status or disease risk.
Biomarkers are used for in vitro as well as in vivo studies that may include humans. Usually, three specific types of biological markers are identified. Although a few biomarkers may be difficult to classify, usually they are separated into biomarkers of exposure, biomarkers of effect or biomarkers of susceptibility (see table 1).
Table 1. Examples of biomarkers of exposure or biomarkers of effect that are used in toxicological studies in occupational health
| Sample | Measurement | Purpose |
| Exposure biomarkers | ||
| Adipose tissue | Dioxin | Dioxin exposure |
| Blood | Lead | Lead exposure |
| Bone | Aluminium | Aluminium exposure |
| Exhaled breath | Toluene | Toluene exposure |
| Hair | Mercury | Methylmercury exposure |
| Serum | Benzene | Benzene exposure |
| Urine | Phenol | Benzene exposure |
| Effect biomarkers | ||
| Blood | Carboxyhaemoglobin | Carbon monoxide exposure |
| Red blood cells | Zinc-protoporphyrin | Lead exposure |
| Serum | Cholinesterase | Organophosphate exposure |
| Urine | Microglobulins | Nephrotoxic exposure |
| White blood cells | DNA adducts | Mutagen exposure |
Given an acceptable degree of validity, biomarkers may be employed for several purposes. On an individual basis, a biomarker may be used to support or refute a diagnosis of a particular type of poisoning or other chemically-induced adverse effect. In a healthy subject, a biomarker may also reflect individual hypersusceptibility to specific chemical exposures and may therefore serve as a basis for risk prediction and counselling. In groups of exposed workers, some exposure biomarkers can be applied to assess the extent of compliance with pollution abatement regulations or the effectiveness of preventive efforts in general.
Biomarkers of Exposure
An exposure biomarker may be an exogenous compound (or a metabolite) within the body, an interactive product between the compound (or metabolite) and an endogenous component, or another event related to the exposure. Most commonly, biomarkers of exposures to stable compounds, such as metals, comprise measurements of the metal concentrations in appropriate samples, such as blood, serum or urine. With volatile chemicals, their concentration in exhaled breath (after inhalation of contamination-free air) may be assessed. If the compound is metabolized in the body, one or more metabolites may be chosen as a biomarker of the exposure; metabolites are often determined in urine samples.
Modern methods of analysis may allow separation of isomers or congeners of organic compounds, and determination of the speciation of metal compounds or isotopic ratios of certain elements. Sophisticated analyses allow determination of changes in the structure of DNA or other macromolecules caused by binding with reactive chemicals. Such advanced techniques will no doubt gain considerably in importance for applications in biomarker studies, and lower detection limits and better analytical validity are likely to make these biomarkers even more useful.
Particularly promising developments have occurred with biomarkers of exposure to mutagenic chemicals. These compounds are reactive and may form adducts with macromolecules, such as proteins or DNA. DNA adducts may be detected in white blood cells or tissue biopsies, and specific DNA fragments may be excreted in the urine. For example, exposure to ethylene oxide results in reactions with DNA bases, and, after excision of the damaged base, N-7-(2-hydroxyethyl)guanine will be eliminated in the urine. Some adducts may not refer directly to a particular exposure. For example, 8-hydroxy-2´-deoxyguanosine reflects oxidative damage to DNA, and this reaction may be triggered by several chemical compounds, most of which also induce lipid peroxidation.
Other macromolecules may also be changed by adduct formation or oxidation. Of special interest, such reactive compounds may generate haemoglobin adducts that can be determined as biomarkers of exposure to the compounds. The advantage is that ample amounts of haemoglobin can be obtained from a blood sample, and, given the four-month lifetime of red blood cells, the adducts formed with the amino acids of the protein will indicate the total exposure during this period.
Adducts may be determined by sensitive techniques such as high-performance lipid chromatography, and some immunological methods are also available. In general, the analytical methods are new, expensive and need further development and validation. Better sensitivity can be obtained by using the 32P post labelling assay, which is a nonspecific indication that DNA damage has taken place. All of these techniques are potentially useful for biological monitoring and have been applied in a growing number of studies. However, simpler and more sensitive analytical methods are needed. Given the limited specificity of some methods at low-level exposures, tobacco smoking or other factors may impact significantly on the measurement results, thus causing difficulties in interpretation.
Exposure to mutagenic compounds, or to compounds which are metabolized into mutagens, may also be determined by assessing the mutagenicity of the urine from an exposed individual. The urine sample is incubated with a strain of bacteria in which a specific point mutation is expressed in a way that can be easily measured. If mutagenic chemicals are present in the urine sample, then an increased rate of mutations will occur in the bacteria.
Exposure biomarkers must be evaluated with regard to temporal variation in exposure and the relation to different compartments. Thus, the time frame(s) represented by the biomarker, that is, the extent to which the biomarker measurement reflects past exposure(s) and/or accumulated body burden, must be determined from toxicokinetic data in order to interpret the result. In particular, the degree to which the biomarker indicates retention in specific target organs should be considered. Although blood samples are often used for biomarker studies, peripheral blood is generally not regarded as a compartment as such, although it acts as a transport medium between compartments. The degree to which the concentration in the blood reflects levels in different organs varies widely between different chemicals, and usually also depends upon the length of the exposure as well as time since exposure.
Sometimes this type of evidence is used to classify a biomarker as an indicator of (total) absorbed dose or an indicator of effective dose (i.e., the amount that has reached the target tissue). For example, exposure to a particular solvent may be evaluated from data on the actual concentration of the solvent in the blood at a particular time following the exposure. This measurement will reflect the amount of the solvent that has been absorbed into the body. Some of the absorbed amount will be exhaled due to the vapour pressure of the solvent. While circulating in the blood, the solvent will interact with various components of the body, and it will eventually become subject to breakdown by enzymes. The outcome of the metabolic processes can be assessed by determining specific mercapturic acids produced by conjugation with glutathione. The cumulative excretion of mercapturic acids may better reflect the effective dose than will the blood concentration.
Life events, such as reproduction and senescence, may affect the distribution of a chemical. The distribution of chemicals within the body is significantly affected by pregnancy, and many chemicals may pass the placental barrier, thus causing exposure of the foetus. Lactation may result in excretion of lipid-soluble chemicals, thus leading to a decreased retention in the mother along with an increased uptake by the infant. During weight loss or development of osteoporosis, stored chemicals may be released, which can then result in a renewed and protracted “endogenous” exposure of target organs. Other factors may affect individual absorption, metabolism, retention and distribution of chemical compounds, and some biomarkers of susceptibility are available (see below).
Biomarkers of Effect
A marker of effect may be an endogenous component, or a measure of the functional capacity, or some other indicator of the state or balance of the body or organ system, as affected by the exposure. Such effect markers are generally preclinical indicators of abnormalities.
These biomarkers may be specific or non-specific. The specific biomarkers are useful because they indicate a biological effect of a particular exposure, thus providing evidence that can potentially be used for preventive purposes. The non-specific biomarkers do not point to an individual cause of the effect, but they may reflect the total, integrated effect due to a mixed exposure. Both types of biomarkers may therefore be of considerable use in occupational health.
There is not a clear distinction between exposure biomarkers and effect biomarkers. For example, adduct formation could be said to reflect an effect rather than the exposure. However, effect biomarkers usually indicate changes in the functions of cells, tissues or the total body. Some researchers include gross changes, such as an increase in liver weight of exposed laboratory animals or decreased growth in children, as biomarkers of effect. For the purpose of occupational health, effect biomarkers should be restricted to those that indicate subclinical or reversible biochemical changes, such as inhibition of enzymes. The most frequently used effect biomarker is probably inhibition of cholinesterase caused by certain insecticides, that is, organophosphates and carbamates. In most cases, this effect is entirely reversible, and the enzyme inhibition reflects the total exposure to this particular group of insecticides.
Some exposures do not result in enzyme inhibition but rather in increased activity of an enzyme. This is the case with several enzymes that belong to the P450 family (see “Genetic determinants of toxic response”). They may be induced by exposures to certain solvents and polyaromatic hydrocarbons (PAHs). Since these enzymes are mainly expressed in tissues from which a biopsy may be difficult to obtain, the enzyme activity is determined indirectly in vivo by administering a compound that is metabolized by that particular enzyme, and then the breakdown product is measured in urine or plasma.
Other exposures may induce the synthesis of a protective protein in the body. The best example is probably metallothionein, which binds cadmium and promotes the excretion of this metal; cadmium exposure is one of the factors that result in increased expression of the metallothionein gene. Similar protective proteins may exist but have not yet been explored sufficiently to become accepted as biomarkers. Among the candidates for possible use as biomarkers are the so-called stress proteins, originally referred to as heat shock proteins. These proteins are generated by a range of different organisms in response to a variety of adverse exposures.
Oxidative damage may be assessed by determining the concentration of malondialdehyde in serum or the exhalation of ethane. Similarly, the urinary excretion of proteins with a small molecular weight, such as albumin, may be used as a biomarker of early kidney damage. Several parameters routinely used in clinical practice (for example, serum hormone or enzyme levels) may also be useful as biomarkers. However, many of these parameters may not be sufficiently sensitive to detect early impairment.
Another group of effect parameters relate to genotoxic effects (changes in the structure of chromosomes). Such effects may be detected by microscopy of white blood cells that undergo cell division. Serious damage to the chromosomes—chromosomal aberrations or formation of micronuclei—can be seen in a microscope. Damage may also be revealed by adding a dye to the cells during cell division. Exposure to a genotoxic agent can then be visualized as an increased exchange of the dye between the two chromatids of each chromosome (sister chromatid exchange). Chromosomal aberrations are related to an increased risk of developing cancer, but the significance of an increased rate of sister chromatid exchange is less clear.
More sophisticated assessment of genotoxicity is based on particular point mutations in somatic cells, that is, white blood cells or epithelial cells obtained from the oral mucosa. A mutation at a specific locus may make the cells capable of growing in a culture that contains a chemical that is otherwise toxic (such as 6-thioguanine). Alternatively, a specific gene product can be assessed (e.g., serum or tissue concentrations of oncoproteins encoded by particular oncogenes). Obviously, these mutations reflect the total genotoxic damage incurred and do not necessarily indicate anything about the causative exposure. These methods are not yet ready for practical use in occupational health, but rapid progress in this line of research would suggest that such methods will become available within a few years.
Biomarkers of Susceptibility
A marker of susceptibility, whether inherited or induced, is an indicator that the individual is particularly sensitive to the effect of a xenobiotic or to the effects of a group of such compounds. Most attention has been focused on genetic susceptibility, although other factors may be at least as important. Hypersusceptibility may be due to an inherited trait, the constitution of the individual, or environmental factors.
The ability to metabolize certain chemicals is variable and is genetically determined (see “Genetic determinants of toxic response”). Several relevant enzymes appear to be controlled by a single gene. For example, oxidation of foreign chemicals is mainly carried out be a family of enzymes belonging to the P450 family. Other enzymes make the metabolites more water soluble by conjugation (e.g., N-acetyltransferase and μ-glutathion-S-transferase). The activity of these enzymes is genetically controlled and varies considerably. As mentioned above, the activity can be determined by administering a small dose of a drug and then determining the amount of the metabolite in the urine. Some of the genes have now been characterized, and techniques are available to determine the genotype. Important studies suggest that a risk of developing certain cancer forms is related to the capability of metabolizing foreign compounds. Many questions still remain unanswered, thus at this time limiting the use of these potential susceptibility biomarkers in occupational health.
Other inherited traits, such as alpha1-antitrypsin deficiency or glucose-6-phosphate dehydrogenase deficiency, also result in deficient defence mechanisms in the body, thereby causing hypersusceptibility to certain exposures.
Most research related to susceptibility has dealt with genetic predisposition. Other factors play a role as well and have been partly neglected. For example, individuals with a chronic disease may be more sensitive to an occupational exposure. Also, if a disease process or previous exposure to toxic chemicals has caused some subclinical organ damage, then the capacity to withstand a new toxic exposure is likely to be less. Biochemical indicators of organ function may in this case be used as susceptibility biomarkers. Perhaps the best example regarding hypersusceptibility relates to allergic responses. If an individual has become sensitized to a particular exposure, then specific antibodies can be detected in serum. Even if the individual has not become sensitized, other current or past exposures may add to the risk of developing an adverse effect related to an occupational exposure.
A major problem is to determine the joint effect of mixed exposures at work. In addition, personal habits and drug use may result in an increased susceptibility. For example, tobacco smoke usually contains a considerable amount of cadmium. Thus, with occupational exposure to cadmium, a heavy smoker who has accumulated substantial amounts of this metal in the body will be at increased risk of developing cadmium-related kidney disease.
Application in Occupational Health
Biomarkers are extremely useful in toxicological research, and many may be applicable in biological monitoring. Nonetheless, the limitations must also be recognized. Many biomarkers have so far been studied only in laboratory animals. Toxicokinetic patterns in other species may not necessarily reflect the situation in human beings, and extrapolation may require confirmatory studies in human volunteers. Also, account must be taken of individual variations due to genetic or constitutional factors.
In some cases, exposure biomarkers may not at all be feasible (e.g., for chemicals which are short-lived in vivo). Other chemicals may be stored in, or may affect, organs which cannot be accessed by routine procedures, such as the nervous system. The route of exposure may also affect the distribution pattern and therefore also the biomarker measurement and its interpretation. For example, direct exposure of the brain via the olfactory nerve is likely to escape detection by measurement of exposure biomarkers. As to effect biomarkers, many of them are not at all specific, and the change can be due to a variety of causes, including lifestyle factors. Perhaps in particular with the susceptibility biomarkers, interpretation must be very cautious at the moment, as many uncertainties remain about the overall health significance of individual genotypes.
In occupational health, the ideal biomarker should satisfy several requirements. First of all, sample collection and analysis must be simple and reliable. For optimal analytical quality, standardization is needed, but the specific requirements vary considerably. Major areas of concern include: preparation of the in- dividual, sampling procedure and sample handling, and measurement procedure; the latter encompasses technical factors, such as calibration and quality assurance procedures, and individual- related factors, such as education and training of operators.
For documentation of analytical validity and traceability, reference materials should be based on relevant matrices and with appropriate concentrations of toxic substances or relevant metabolites at appropriate levels. For biomarkers to be used for biological monitoring or for diagnostic purposes, the responsible laboratories must have well-documented analytical procedures with defined performance characteristics, and accessible records to allow verification of the results. At the same time, nonetheless, the economics of characterizing and using reference materials to supplement quality assurance procedures in general must be considered. Thus, the achievable quality of results, and the uses to which they are put, have to be balanced against the added costs of quality assurance, including reference materials, manpower and instrumentation.
Another requirement is that the biomarker should be specific, at least under the circumstances of the study, for a particular type of exposure, with a clear-cut relationship to the degree of exposure. Otherwise, the result of the biomarker measurement may be too difficult to interpret. For proper interpretation of the measurement result of an exposure biomarker, the diagnostic validity must be known (i.e., the translation of the biomarker value into the magnitude of possible health risks). In this area, metals serve as a paradigm for biomarker research. Recent research has demonstrated the complexity and subtlety of dose-response relationships, with considerable difficulty in identifying no-effect levels and therefore also in defining tolerable exposures. However, this kind of research has also illustrated the types of investigation and the refinement that are necessary to uncover the relevant information. For most organic compounds, quantitative associations between exposures and the corresponding adverse health effects are not yet available; in many cases, even the primary target organs are not known for sure. In addition, evaluation of toxicity data and biomarker concentrations is often complicated by exposure to mixtures of substances, rather than exposure to a single compound at the time.
Before the biomarker is applied for occupational health purposes, some additional considerations are necessary. First, the biomarker must reflect a subclinical and reversible change only. Second, given that the biomarker results can be interpreted with regard to health risks, then preventive efforts should be available and should be considered realistic in case the biomarker data suggests a need to reduce the exposure. Third, the practical use of the biomarker must be generally regarded as ethically acceptable.
Industrial hygiene measurements may be compared with applicable exposure limits. Likewise, results on exposure biomarkers or effect biomarkers may be compared to biological action limits, sometimes referred to as biological exposure indices. Such limits should be based on the best advice of clinicians and scientists from appropriate disciplines, and responsible administrators as “risk managers” should then take into account relevant ethical, social, cultural and economic factors. The scientific basis should, if possible, include dose-response relationships supplemented by information on variations in susceptibility within the population at risk. In some countries, workers and members of the general public are involved in the standard-setting process and provide important input, particularly when scientific uncertainty is considerable. One of the major uncertainties is how to define an adverse health effect that should be prevented—for example, whether adduct formation as an exposure biomarker by itself represents an adverse effect (i.e., effect biomarker) that should be prevented. Difficult questions are likely to arise when deciding whether it is ethically defensible, for the same compound, to have different limits for adventitious exposure, on the one hand, and occupational exposure, on the other.
The information generated by the use of biomarkers should generally be conveyed to the individuals examined within the physician-patient relationship. Ethical concerns must in particular be considered in connection with highly experimental biomarker analyses that cannot currently be interpreted in detail in terms of actual health risks. For the general population, for example, limited guidance exists at present with regard to interpretation of exposure biomarkers other than the blood-lead concentration. Also of importance is the confidence in the data generated (i.e., whether appropriate sampling has been done, and whether sound quality assurance procedures have been utilized in the laboratory involved). An additional area of special worry relates to individual hypersusceptibility. These issues must be taken into account when providing the feedback from the study.
All sectors of society affected by, or concerned with carrying out, a biomarker study need to be involved in the decision-making process on how to handle the information generated by the study. Specific procedures to prevent or overcome inevitable ethical conflicts should be developed within the legal and social frameworks of the region or country. However, each situation represents a different set of questions and pitfalls, and no single procedure for public involvement can be developed to cover all applications of exposure biomarkers.
Vigilance
The concept of vigilance refers to a human observer’s state of alertness in tasks that demand efficient registration and processing of signals. The main characteristics of vigilance tasks are relatively long durations and the requirement to detect infrequent and unpredictable target stimuli (signals) against a background of other stimulus events.
Vigilance Tasks
The prototypical task for vigilance research was that of radar operators. Historically, their apparently unsatisfactory performance during the Second World War has been a major impetus for the extensive study of vigilance. Another major task requiring vigilance is an industrial inspection. More generally, all kinds of monitoring tasks which require the detection of relatively infrequent signals embody the risk of failures to detect and to respond to these critical events.
Vigilance tasks make up a heterogeneous set and vary on several dimensions, in spite of their common characteristics. An obviously important dimension is the overall stimulus rate as well as the rate of target stimuli. It is not always possible to define the stimulus rate unambiguously. This is the case in tasks that require the detection of target events against continuously presented background stimuli, as in detecting critical values on a set of dials in a monitoring task. A less obviously important distinction is that between successive-discrimination tasks and simultaneous-discrimination tasks. In simultaneous-discrimination tasks, both target stimuli and background stimuli are present at the same time, while in successive-discrimination tasks one is presented after the other so that some demands on memory are made. Although most vigilance tasks require the detection of visual stimuli, stimuli in other modalities have also been studied. Stimuli can be confined to a single spatial location, or there can be different sources for target stimuli. Target stimuli can differ from background stimuli by physical characteristics, but also by more conceptual ones (like a certain pattern of meter readings that can differ from other patterns). Of course, the conspicuousness of targets can vary: some can be detected easily, while others may be hard to discriminate from background stimuli. Target stimuli can be unique or there can be sets of target stimuli without well-defined boundaries to set them off from background stimuli, as is the case in many industrial inspection tasks. This list of dimensions on which vigilance tasks differ can be expanded, but even this length of the list suffices to emphasize the heterogeneity of vigilance tasks and thus the risks involved in generalizing certain observations across the full set.
Performance Variations and the Vigilance Decrement
The most frequently used performance measure in vigilance tasks is the proportion of target stimuli, for example, faulty products in industrial inspection, that have been detected; this is an estimate of the probability of so-called hits. Those target stimuli that remain unnoticed are called misses. Although the hit rate is a convenient measure, it is somewhat incomplete. There is a trivial strategy that allows one to achieve 100% hits: one only has to classify all stimuli as targets. However, the hit rate of 100% is then accompanied by a false-alarm rate of 100%, that is, not only the target stimuli are correctly detected, but the background stimuli are incorrectly “detected” as well. This line of reasoning makes it quite clear that whenever there are false alarms at all, it is important to know their proportion in addition to the hit rate. Another measure for performance in a vigilance task is the time needed to respond to target stimuli (response time).
Performance in vigilance tasks exhibits two typical attributes. The first one is the low overall level of vigilance performance. It is low in comparison with an ideal situation for the same stimuli (short observation periods, high readiness of the observer for each discrimination, etc.). The second attribute is the so-called vigilance decrement, the decline of performance in the course of the watch which can start within the first few minutes. Both these observations refer to the proportion of hits, but they have also been reported for response times. Although the vigilance decrement is typical of vigilance tasks, it is not universal.
In investigating the causes of poor overall performance and vigilance decrements, a distinction will be made among concepts that are related to the basic characteristics of the task and concepts that are related to organismic and task-unrelated situational factors. Among the task-related factors strategic and non-strategic ones can be distinguished.
Strategic processes in vigilance tasks
The detection of a signal like a faulty product is partly a matter of the observer’s strategy and partly a matter of the signal’s discriminability. This distinction is based on the theory of signal detection (TSD), and some basics of the theory need to be presented in order to highlight the distinction’s importance. Consider a hypothetical variable, defined as “evidence for the presence of a signal”. Whenever a signal is presented, this variable takes on some value, and whenever a background stimulus is presented, it takes on a value that is lower on the average. The value of the evidence variable is assumed to vary across repeated presentations of the signal. Thus it can be characterized by a so-called probability density function as is illustrated in figure 1. Another density function characterizes the values of the evidence variable upon presentation of a background stimulus. When the signals are similar to the background stimuli, the functions will overlap, so that a certain value of the evidence variable can originate either from a signal or from a background stimulus. The particular shape of the density functions of figure 1 is not essential for the argument.
Figure 1. Thresholds and discriminability
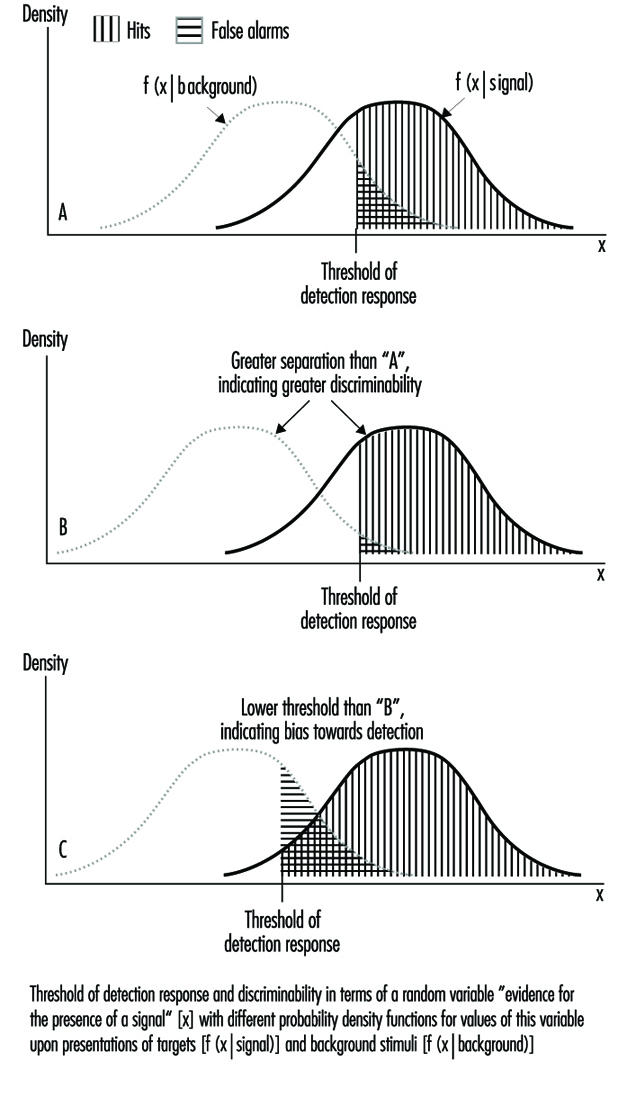
The detection response of the observer is based on the evidence variable. It is assumed that a threshold is set so that a detection response is given whenever the value of the evidence variable is above the threshold. As is illustrated in figure 1, the areas under the density functions to the right of the threshold correspond to the probabilities of hits and false alarms. In practice, estimates of the separation of the two functions and the location of the threshold can be derived. The separation of the two density functions characterizes the discriminability of the target stimuli from the background stimuli, while the location of the threshold characterizes the observer’s strategy. Variation of the threshold produces a joint variation of the proportions of hits and false alarms. With a high threshold, the proportions of hits and false alarms will be small, while with a low threshold the proportions will be large. Thus, the selection of a strategy (placement of the threshold) essentially is the selection of a certain combination of hit rate and false-alarm rate among the combinations that are possible for a certain discriminability.
Two major factors that influence the location of the threshold are payoffs and signal frequency. The threshold will be set to lower values when there is much to gain from a hit and little to lose from a false alarm, and it will be set to higher values when false alarms are costly and the benefits from hits are small. A low threshold setting can also be induced by a high proportion of signals, while a low proportion of signals tends to induce higher threshold settings. The effect of signal frequency on threshold settings is a major factor for the low overall performance in terms of the proportion of hits in vigilance tasks and for the vigilance decrement.
An account of the vigilance decrement in terms of strategic changes (threshold changes) requires that the reduction of the proportion of hits in the course of the watch is accompanied by a reduction of the proportion of false alarms. This is, in fact, the case in many studies, and it is likely that the overall poor performance in vigilance tasks (in comparison with the optimal situation) does also result, at least partly, from a threshold adjustment. In the course of a watch, the relative frequency of detection responses comes to match the relative frequency of targets, and this adjustment implies a high threshold with a relatively small proportion of hits and a relatively small proportion of false alarms as well. Nevertheless, there are vigilance decrements that result from changes in discriminability rather than from changes in threshold settings. These have been observed mainly in successive-discrimination tasks with a relatively high rate of stimulus events.
Nonstrategic processes in vigilance tasks
Although part of the overall poor performance in vigilance tasks and many instances of the vigilance decrement can be accounted for in terms of strategic adjustments of the detection threshold to low signal rates, such an account is not complete. There are changes in the observer during a watch that can reduce the discriminability of stimuli or result in apparent threshold shifts that cannot be considered as an adaptation to the task characteristics. In the more than 40 years of vigilance research, a number of nonstrategic factors that contribute to poor overall performance and to the vigilance decrement have been identified.
A correct response to a target in a vigilance task requires a sufficiently precise sensory registration, an appropriate threshold location, and a link between the perceptual processes and the associated response-related processes. During the watch the observers have to maintain a certain task set, a certain readiness to respond to target stimuli in a certain way. This is a nontrivial requirement because without a particular task set no observer would respond to target stimuli in the way required. Two major sources of failures are thus inaccurate sensory registration and lapses in the readiness to respond to target stimuli. Major hypotheses to account for such failures will be briefly reviewed.
Detection and identification of a stimulus are faster when there is no temporal or spatial uncertainty about its appearance. Temporal and/or spatial uncertainty is likely to reduce vigilance performance. This is the essential prediction of expectancy theory. Optimal preparedness of the observer requires temporal and spatial certainty; obviously vigilance tasks are less than optimal in this respect. Although the major focus of expectancy theory is on the overall low performance, it can also serve to account for parts of the vigilance decrement. With infrequent signals at random intervals, high levels of preparedness might initially exist at times when no signal is presented; in addition, signals will be presented at low levels of preparedness. This discourages occasional high levels of preparedness in general so that whatever benefits accrue from them will vanish in the course of a watch.
Expectancy theory has a close relation to attentional theories. Variants of attentional theories of vigilance, of course, are related to dominant theories of attention in general. Consider a view of attention as “selection for processing” or “selection for action”. According to this view, stimuli are selected from the environment and processed with high efficiency whenever they serve the currently dominant action plan or task set. As already said, the selection will benefit from precise expectations about when and where such stimuli will occur. But stimuli will only be selected if the action plan—the task set—is active. (Drivers of cars, for example, respond to traffic lights, other traffic, etc.; passengers don’t do so normally, although both are in almost the same situation. The critical difference is that between the task sets of the two: only the driver’s task set requires responses to traffic lights.)
The selection of stimuli for processing will suffer when the action plan is temporarily deactivated, that is when the task set is temporarily absent. Vigilance tasks embody a number of features that discourage continuous maintenance of the task set, like short cycle times for processing stimuli, lack of feedback and little motivational challenge by apparent task difficulty. So-called blockings can be observed in almost all simple cognitive tasks with short cycle times like simple mental arithmetic or rapid serial responses to simple signals. Similar blockings occur in the maintenance of the task set in a vigilance task as well. They are not immediately recognizable as delayed responses because responses are infrequent and targets that are presented during a period of absent task set may no longer be there when the absence is over so that a miss will be observed instead of a delayed response. Blockings become more frequent with time spent on the task. This can give rise to the vigilance decrement. There may be additional reasons for temporary lapses in the availability of the appropriate task set, for example, distraction.
Certain stimuli are not selected in the service of the current action plan, but by virtue of their own characteristics. These are stimuli that are intense, novel, moving toward the observer, have an abrupt onset or for any other reason might require immediate action no matter what the current action plan of the observer is. There is little risk of not detecting such stimuli. They attract attention automatically, as is indicated, for example, by the orienting response, which includes a shift of the direction of the gaze toward the stimulus source. However, answering an alarm bell is not normally considered a vigilance task. In addition to stimuli that attract attention by their own characteristics, there are stimuli that are processed automatically as a consequence of the practice. They seem to “pop out” from the environment. This kind of automatic processing requires extended practice with a so-called consistent mapping, that is, a consistent assignment of responses to stimuli. The vigilance decrement is likely to be small or even absent once automatic processing of stimuli has been developed.
Finally, vigilance performance suffers from a lack of arousal. This concept refers in a rather global manner to the intensity of neural activity, ranging from sleep through normal wakefulness to high excitement. One of the factors that is thought to affect arousal is external stimulation, and this is fairly low and uniform in most vigilance tasks. Thus, the intensity of central nervous system activity can decline overall over the course of a watch. An important aspect of arousal theory is that it links vigilance performance to various task-unrelated situational factors and factors related to the organism.
The Influence of Situational and Organismic Factors
Low arousal contributes to poor performance in vigilance tasks. Thus performance can be enhanced by situational factors that tend to enhance arousal, and it can be reduced by all measures that reduce the level of arousal. On balance, this generalization is mostly correct for the overall performance level in vigilance tasks, but the effects on the vigilance decrement are absent or less reliably observed across different kinds of manipulation of arousal.
One way to raise the level of arousal is the introduction of additional noise. However, the vigilance decrement is generally unaffected, and with respect to overall performance the results are inconsistent: enhanced, unchanged and reduced performance levels have all been observed. Perhaps the complex nature of noise is relevant. For example, it can be affectively neutral or annoying; it cannot only be arousing, but also be distracting. More consistent are the effects of sleep deprivation, which is “de-arousing”. It generally reduces vigilance performance and has sometimes been seen to enhance the vigilance decrement. Appropriate changes of vigilance performance have also been observed with depressant drugs like benzodiazepines or alcohol and stimulant drugs like amphetamine, caffeine or nicotine.
Individual differences are a conspicuous feature of performance in vigilance tasks. Although individual differences are not consistent across all sorts of vigilance tasks, they are fairly consistent across similar ones. There is only little or no effect of sex and general intelligence. With respect to age, vigilance performance increases during childhood and tends to decline beyond the age of sixty. In addition there is a good chance that introverts will show better performance than extroverts.
The Enhancement of Vigilance Performance
The existing theories and data suggest some means to enhance vigilance performance. Depending on the amount of specificity of the suggestions, it is not difficult to compile lists of various lengths. Some rather broad suggestions are given below that have to be fitted to specific task requirements. They are related to the ease of perceptual discriminations, the appropriate strategic adjustments, the reduction of uncertainty, the avoidance of the effects of attentional lapses and the maintenance of arousal.
Vigilance tasks require discriminations under non-optimal conditions. Thus one is well advised in making the discriminations as easy as possible, or the signals as conspicuous as possible. Measures related to this general goal can be straightforward (like appropriate lighting or longer inspection times per product) or more sophisticated, including special devices to enhance the conspicuousness of targets. Simultaneous comparisons are easier than successive ones, so the availability of a reference standard can be helpful. By means of technical devices, it is sometimes possible to present the standard and the object to be examined in rapid alternation, so that differences will appear as motions in the display or other changes for which the visual system is particularly sensitive.
To counteract the strategic changes of the threshold that lead to a relatively low proportion of correct detections of targets (and for making the task less boring in terms of the frequency of actions to be taken) the suggestion has been made to introduce fake targets. However, this seems not to be a good recommendation. Fake targets will increase the proportion of hits overall but at the cost of more frequent false alarms. In addition, the proportion of undetected targets among all stimuli that are not responded to (the outgoing faulty material in an industrial inspection task) will not necessarily be reduced. Better suited seems to be explicit knowledge about the relative importance of hits and false alarms and perhaps other measures to obtain an appropriate placement of the threshold for deciding between “good” and “bad”.
Temporal and spatial uncertainty are important determinants of poor vigilance performance. For some tasks, spatial uncertainty can be reduced by way of defining a certain position of the object to be inspected. However, little can be done about temporal uncertainty: the observer would be unnecessary in a vigilance task if the occurrence of a target could be signaled in advance of its presentation. One thing that can be done in principle, however, is to mix objects to be inspected if faults tend to occur in bunches; this serves to avoid very long intervals without targets as well as very short intervals.
There are some obvious suggestions for the reduction of attentional lapses or at least their impact on performance. By proper training, some kind of automatic processing of targets can perhaps be obtained provided that the background and target stimuli are not too variable. The requirement for sustained maintenance of the task set can be avoided by means of frequent short breaks, job rotation, job enlargement or job enrichment. Introduction of variety can be as simple as having the inspector himself or herself getting the material to be inspected from a box or other location. This also introduces self-pacing, which may help in avoiding signal presentations during temporary deactivations of the task set. Sustained maintenance of task set can be supported by means of feedback, indicated interest by supervisors and operator’s awareness of the importance of the task. Of course, accurate feedback of performance level is not possible in typical vigilance tasks; however, even inaccurate or incomplete feedback can be helpful as far as the observer’s motivation is concerned.
There are some measures that can be taken to maintain a sufficient level of arousal. Continuous use of drugs may exist in practice but is never found among recommendations. Some background music can be useful, but can also have an opposite effect. Social isolation during vigilance tasks should mostly be avoided, and during times of day with low levels of arousal like the late hours of the night, supportive measures such as short watches are particularly important.
Genetic Toxicity Assessment
Genetic toxicity assessment is the evaluation of agents for their ability to induce any of three general types of changes (mutations) in the genetic material (DNA): gene, chromosomal and genomic. In organisms such as humans, the genes are composed of DNA, which consists of individual units called nucleotide bases. The genes are arranged in discrete physical structures called chromosomes. Genotoxicity can result in significant and irreversible effects upon human health. Genotoxic damage is a critical step in the induction of cancer and it can also be involved in the induction of birth defects and foetal death. The three classes of mutations mentioned above can occur within either of the two types of tissues possessed by organisms such as humans: sperm or eggs (germ cells) and the remaining tissue (somatic cells).
Assays that measure gene mutation are those that detect the substitution, addition or deletion of nucleotides within a gene. Assays that measure chromosomal mutation are those that detect breaks or chromosomal rearrangements involving one or more chromosomes. Assays that measure genomic mutation are those that detect changes in the number of chromosomes, a condition called aneuploidy. Genetic toxicity assessment has changed considerably since the development by Herman Muller in 1927 of the first assay to detect genotoxic (mutagenic) agents. Since then, more than 200 assays have been developed that measure mutations in DNA; however, fewer than ten assays are used commonly today for genetic toxicity assessment. This article reviews these assays, describes what they measure, and explores the role of these assays in toxicity assessment.
Identification of Cancer HazardsPrior to the Development of the Fieldof Genetic Toxicology
Genetic toxicology has become an integral part of the overall risk assessment process and has gained in stature in recent times as a reliable predictor for carcinogenic activity. However, prior to the development of genetic toxicology (before 1970), other methods were and are still being used to identify potential cancer hazards to humans. There are six major categories of methods currently used for identifying human cancer risks: epidemiological studies, long-term in vivo bioassays, mid-term in vivo bioassays, short-term in vivo and in vitro bioassays, artificial intelligence (structure-activity), and mechanism-based inference.
Table 1 gives advantages and disadvantages for these methods.
Table 1. Advantages and disadvantages of current methods for identifying human cancer risks
| Advantages | Disadvantages | |
| Epidemiological studies | (1) humans are ultimate indicators of disease; (2) evaluate sensitive or susceptible populations; (3) occupational exposure cohorts; (4) environmental sentinel alerts |
(1) generally retrospective (death certificates, recall biases, etc.); (2) insensitive, costly, lengthy; (3) reliable exposure data sometimes unavailable or difficult to obtain; (4) combined, multiple and complex exposures; lack of appropriate control cohorts; (5) experiments on humans not done; (6) cancer detection, not prevention |
| Long-term in vivo bioassays | (1) prospective and retrospective (validation) evaluations; (2) excellent correlation with identified human carcinogens; (3) exposure levels and conditions known; (4) identifies chemical toxicity and carcinogenicity effects; (5) results obtained relatively quickly; (6) qualitative comparisons among chemical classes; (7) integrative and interactive biologic systems related closely to humans | (1) rarely replicated, resource intensive; (3) limited facilities suitable for such experiments; (4) species extrapolation debate; (5) exposures used are often at levels far in excess of those experienced by humans; (6) single-chemical exposure does not mimic human exposures, which are generally to multiple chemicals simultaneously |
| Mid- and short-term in vivo and in vitro bioassays | (1) more rapid and less expensive than other assays; (2) large samples that are easily replicated; (3) biologically meaningful end points are measured (mutation, etc.); (4) can be used as screening assays to select chemicals for long-term bioassays |
(1) in vitro not fully predictive of in vivo; (2) usually organism or organ specific; (3) potencies not comparable to whole animals or humans |
| Chemical structure–biological activity associations | (1) relatively easy, rapid, and inexpensive; (2) reliable for certain chemical classes (e.g., nitrosamines and benzidine dyes); (3) developed from biological data but not dependent on additional biological experimentation | (1) not “biological”; (2) many exceptions to formulated rules; (3) retrospective and rarely (but becoming) prospective |
| Mechanism-based inferences | (1) reasonably accurate for certain classes of chemicals; (2) permits refinements of hypotheses; (3) can orient risk assessments to sensitive populations | (1) mechanisms of chemical carcinogenesis undefined, multiple, and likely chemical or class specific; (2) may fail to highlight exceptions to general mechanisms |
Rationale and Conceptual Basisfor Genetic Toxicology Assays
Although the exact types and numbers of assays used for genetic toxicity assessment are constantly evolving and vary from country to country, the most common ones include assays for (1) gene mutation in bacteria and/or cultured mammalian cells and (2) chromosomal mutation in cultured mammalian cells and/or bone marrow within living mice. Some of the assays within this second category can also detect aneuploidy. Although these assays do not detect mutations in germ cells, they are used primarily because of the extra cost and complexity of performing germ-cell assays. Nonetheless, germ-cell assays in mice are used when information about germ-cell effects is desired.
Systematic studies over a 25-year period (1970-1995), especially at the US National Toxicology Program in North Carolina, have resulted in the use of a discrete number of assays for detecting the mutagenic activity of agents. The rationale for evaluating the usefulness of the assays was based on their ability to detect agents that cause cancer in rodents and that are suspected of causing cancer in humans (i.e., carcinogens). This is because studies during the past several decades have indicated that cancer cells contain mutations in certain genes and that many carcinogens are also mutagens. Thus, cancer cells are viewed as containing somatic-cell mutations, and carcinogenesis is viewed as a type of somatic-cell mutagenesis.
The genetic toxicity assays used most commonly today have been selected not only because of their large database, relatively low cost, and ease of performance, but because they have been shown to detect many rodent and, presumptively, human carcinogens. Consequently, genetic toxicity assays are used to predict the potential carcinogenicity of agents.
An important conceptual and practical development in the field of genetic toxicology was the recognition that many carcinogens were modified by enzymes within the body, creating altered forms (metabolites) that were frequently the ultimate carcinogenic and mutagenic form of the parent chemical. To duplicate this metabolism in a petri dish, Heinrich Malling showed that the inclusion of a preparation from rodent liver contained many of the enzymes necessary to perform this metabolic conversion or activation. Thus, many genetic toxicity assays performed in dishes or tubes (in vitro) employ the addition of similar enzyme preparations. Simple preparations are called S9 mix, and purified preparations are called microsomes. Some bacterial and mammalian cells have now been genetically engineered to contain some of the genes from rodents or humans that produce these enzymes, reducing the need to add S9 mix or microsomes.
Genetic Toxicology Assays and Techniques
The primary bacterial systems used for genetic toxicity screening are the Salmonella (Ames) mutagenicity assay and, to a much lesser extent, strain WP2 of Escherichia coli. Studies in the mid-1980s indicated that the use of only two strains of the Salmonella system (TA98 and TA100) were sufficient to detect approximately 90% of the known Salmonella mutagens. Thus, these two strains are used for most screening purposes; however, various other strains are available for more extensive testing.
These assays are performed in a variety of ways, but two general procedures are the plate-incorporation and liquid-suspension assays. In the plate-incorporation assay, the cells, the test chemical and (when desired) the S9 are added together into a liquefied agar and poured onto the surface of an agar petri plate. The top agar hardens within a few minutes, and the plates are incubated for two to three days, after which time mutant cells have grown to form visually detectable clusters of cells called colonies, which are then counted. The agar medium contains selective agents or is composed of ingredients such that only the newly mutated cells will grow. The liquid-incubation assay is similar, except the cells, test agent, and S9 are incubated together in liquid that does not contain liquefied agar, and then the cells are washed free of the test agent and S9 and seeded onto the agar.
Mutations in cultured mammalian cells are detected primarily in one of two genes: hprt and tk. Similar to the bacterial assays, mammalian cell lines (developed from rodent or human cells) are exposed to the test agent in plastic culture dishes or tubes and then are seeded into culture dishes that contain medium with a selective agent that permits only mutant cells to grow. The assays used for this purpose include the CHO/HPRT, the TK6, and the mouse lymphoma L5178Y/TK+/- assays. Other cell lines containing various DNA repair mutations as well as containing some human genes involved in metabolism are also used. These systems permit the recovery of mutations within the gene (gene mutation) as well as mutations involving regions of the chromosome flanking the gene (chromosomal mutation). However, this latter type of mutation is recovered to a much greater extent by the tk gene systems than by the hprt gene systems due to the location of the tk gene.
Similar to the liquid-incubation assay for bacterial mutagenicity, mammalian cell mutagenicity assays generally involve the exposure of the cells in culture dishes or tubes in the presence of the test agent and S9 for several hours. The cells are then washed, cultured for several more days to allow the normal (wild-type) gene products to be degraded and the newly mutant gene products to be expressed and accumulate, and then they are seeded into medium containing a selective agent that permits only the mutant cells to grow. Like the bacterial assays, the mutant cells grow into visually detectable colonies that are then counted.
Chromosomal mutation is identified primarily by cytogenetic assays, which involve exposing rodents and/or rodent or human cells in culture dishes to a test chemical, allowing one or more cell divisions to occur, staining the chromosomes, and then visually examining the chromosomes through a microscope to detect alterations in the structure or number of chromosomes. Although a variety of endpoints can be examined, the two that are currently accepted by regulatory agencies as being the most meaningful are chromosomal aberrations and a subcategory called micronuclei.
Considerable training and expertise are required to score cells for the presence of chromosomal aberrations, making this a costly procedure in terms of time and money. In contrast, micronuclei require little training, and their detection can be automated. Micronuclei appear as small dots within the cell that are distinct from the nucleus, which contains the chromosomes. Micronuclei result from either chromosome breakage or from aneuploidy. Because of the ease of scoring micronuclei compared to chromosomal aberrations, and because recent studies indicate that agents that induce chromosomal aberrations in the bone marrow of living mice generally induce micronuclei in this tissue, micronuclei are now commonly measured as an indication of the ability of an agent to induce chromosomal mutation.
Although germ-cell assays are used far less frequently than the other assays described above, they are indispensable in determining whether an agent poses a risk to the germ cells, mutations in which can lead to health effects in succeeding generations. The most commonly used germ-cell assays are in mice, and involve systems that detect (1) heritable translocations (exchanges) among chromosomes (heritable translocation assay), (2) gene or chromosomal mutations involving specific genes (visible or biochemical specific-locus assays), and (3) mutations that affect viability (dominant lethal assay). As with the somatic-cell assays, the working assumption with the germ-cell assays is that agents positive in these assays are presumed to be potential human germ-cell mutagens.
Current Status and Future Prospects
Recent studies have indicated that only three pieces of information were necessary to detect approximately 90% of a set of 41 rodent carcinogens (i.e., presumptive human carcinogens and somatic-cell mutagens). These included (1) knowledge of the chemical structure of agent, especially if it contains electrophilic moieties (see section on structure-activity relationships); (2) Salmonella mutagenicity data; and (3) data from a 90-day chronic toxicity assay in rodents (mice and rats). Indeed, essentially all of the IARC-declared human carcinogens are detectable as mutagens using just the Salmonella assay and the mouse-bone marrow micronucleus assay. The use of these mutagenicity assays for detecting potential human carcinogens is supported further by the finding that most human carcinogens are carcinogenic in both rats and mice (trans-species carcinogens) and that most trans- species carcinogens are mutagenic in Salmonella and/or induce micronuclei in mouse bone marrow.
With advances in DNA technology, the human genome project, and an improved understanding of the role of mutation in cancer, new genotoxicity assays are being developed that will likely be incorporated into standard screening procedures. Among these are the use of transgenic cells and rodents. Transgenic systems are those in which a gene from another species has been introduced into a cell or organism. For example, transgenic mice are now in experimental use that permit the detection of mutation in any organ or tissue of the animal, based on the introduction of a bacterial gene into the mouse. Bacterial cells, such as Salmonella, and mammalian cells (including human cell lines) are now available that contain genes involved in the metabolism of carcinogenic/mutagenic agents, such as the P450 genes. Molecular analysis of the actual mutations induced in the trans-gene within transgenic rodents, or within native genes such as hprt, or the target genes within Salmonella can now be performed, so that the exact nature of the mutations induced by the chemicals can be determined, providing insights into the mechanism of action of the chemical and allowing comparisons to mutations in humans presumptively exposed to the agent.
Molecular advances in cytogenetics now permit more detailed evaluation of chromosomal mutations. These include the use of probes (small pieces of DNA) that attach (hybridize) to specific genes. Rearrangements of genes on the chromosome can then be revealed by the altered location of the probes, which are fluorescent and easily visualized as colored sectors on the chromosomes. The single-cell gel electrophoresis assay for DNA breakage (commonly called the “comet” assay) permits the detection of DNA breaks within single cells and may become an extremely useful tool in combination with cytogenetic techniques for detecting chromosomal damage.
After many years of use and the generation of a large and systematically developed database, genetic toxicity assessment can now be done with just a few assays for relatively small cost in a short period of time (a few weeks). The data produced can be used to predict the ability of an agent to be a rodent and, presumptively, human carcinogen/somatic-cell mutagen. Such an ability makes it possible to limit the introduction into the environment of mutagenic and carcinogenic agents and to develop alternative, nonmutagenic agents. Future studies should lead to even better methods with greater predictivity than the current assays.
" DISCLAIMER: The ILO does not take responsibility for content presented on this web portal that is presented in any language other than English, which is the language used for the initial production and peer-review of original content. Certain statistics have not been updated since the production of the 4th edition of the Encyclopaedia (1998)."