- You are here:
-
Home

- Part VI. General Hazards

Children categories

36. Barometric Pressure Increased (2)

36. Barometric Pressure Increased
Chapter Editor: T.J.R. Francis
Table of Contents
Working under Increased Barometric Pressure
Eric Kindwall
Dees F. Gorman
Tables
Click a link below to view table in article context.
1. Instructions for compressed-air workers
2. Decompression illness: Revised classification
37. Barometric Pressure Reduced (4)
37. Barometric Pressure Reduced
Chapter Editor: Walter Dümmer
Table of Contents
Figures and Tables
Ventilatory Acclimatization to High Altitude
John T. Reeves and John V. Weil
Physiological Effects of Reduced Barometric Pressure
Kenneth I. Berger and William N. Rom
Health Considerations for Managing Work at High Altitudes
John B. West
Prevention of Occupational Hazards at High Altitudes
Walter Dümmer
Figures
Point to a thumbnail to see figure caption, click to see figure in article context.


38. Biological Hazards (4)
38. Biological Hazards
Chapter Editor: Zuheir Ibrahim Fakhri
Table of Contents
Tables
Workplace Biohazards
Zuheir I. Fakhri
Aquatic Animals
D. Zannini
Terrestrial Venomous Animals
J.A. Rioux and B. Juminer
Clinical Features of Snakebite
David A. Warrell
Tables
Click a link below to view table in article context.
1. Occupational settings with biological agents
2. Viruses, bacteria, fungi & plants in the workplace
3. Animals as a source of occupational hazards
39. Disasters, Natural and Technological (12)
39. Disasters, Natural and Technological
Chapter Editor: Pier Alberto Bertazzi
Table of Contents
Tables and Figures
Disasters and Major Accidents
Pier Alberto Bertazzi
ILO Convention concerning the Prevention of Major Industrial Accidents, 1993 (No. 174)
Disaster Preparedness
Peter J. Baxter
Post-Disaster Activities
Benedetto Terracini and Ursula Ackermann-Liebrich
Weather-Related Problems
Jean French
Avalanches: Hazards and Protective Measures
Gustav Poinstingl
Transportation of Hazardous Material: Chemical and Radioactive
Donald M. Campbell
Radiation Accidents
Pierre Verger and Denis Winter
Case Study: What does dose mean?
Occupational Health and Safety Measures in Agricultural Areas Contaminated by Radionuclides: The Chernobyl Experience
Yuri Kundiev, Leonard Dobrovolsky and V.I. Chernyuk
Case Study: The Kader Toy Factory Fire
Casey Cavanaugh Grant
Impacts of Disasters: Lessons from a Medical Perspective
José Luis Zeballos
Tables
Click a link below to view table in article context.
1. Definitions of disaster types
2. 25-yr average # victims by type & region-natural trigger
3. 25-yr average # victims by type & region-non-natural trigger
4. 25-yr average # victims by type-natural trigger (1969-1993)
5. 25-yr average # victims by type-non-natural trigger (1969-1993)
6. Natural trigger from 1969 to 1993: Events over 25 years
7. Non-natural trigger from 1969 to 1993: Events over 25 years
8. Natural trigger: Number by global region & type in 1994
9. Non-natural trigger: Number by global region & type in 1994
10. Examples of industrial explosions
11. Examples of major fires
12. Examples of major toxic releases
13. Role of major hazard installations management in hazard control
14. Working methods for hazard assessment
15. EC Directive criteria for major hazard installations
16. Priority chemicals used in identifying major hazard installations
17. Weather-related occupational risks
18. Typical radionuclides, with their radioactive half-lives
19. Comparison of different nuclear accidents
20. Contamination in Ukraine, Byelorussia & Russia after Chernobyl
21. Contamination strontium-90 after the Khyshtym accident (Urals 1957)
22. Radioactive sources that involved the general public
23. Main accidents involving industrial irradiators
24. Oak Ridge (US) radiation accident registry (worldwide, 1944-88)
25. Pattern of occupational exposure to ionizing radiation worldwide
26. Deterministic effects: thresholds for selected organs
27. Patients with acute irradiation syndrome (AIS) after Chernobyl
28. Epidemiological cancer studies of high dose external irradiation
29. Thyroid cancers in children in Belarus, Ukraine & Russia, 1981-94
30. International scale of nuclear incidents
31. Generic protective measures for general population
32. Criteria for contamination zones
33. Major disasters in Latin America & the Caribbean, 1970-93
34. Losses due to six natural disasters
35. Hospitals & hospital beds damaged/ destroyed by 3 major disasters
36. Victims in 2 hospitals collapsed by the 1985 earthquake in Mexico
37. Hospital beds lost resulting from the March 1985 Chilean earthquake
38. Risk factors for earthquake damage to hospital infrastructure
Figures
Point to a thumbnail to see figure caption, click to see figure in article context.
|
|


Click to return to top of page
40. Electricity (3)
40. Electricity
Chapter Editor: Dominique Folliot
Table of Contents
Figures and Tables
Electricity—Physiological Effects
Dominique Folliot
Static Electricity
Claude Menguy
Prevention And Standards
Renzo Comini
Tables
Click a link below to view table in article context.
1. Estimates of the rate of electrocution-1988
2. Basic relationships in electrostatics-Collection of equations
3. Electron affinities of selected polymers
4. Typical lower flammability limits
5. Specific charge associated with selected industrial operations
6. Examples of equipment sensitive to electrostatic discharges
Figures
Point to a thumbnail to see figure caption, click to see figure in article context.


41. Fire (6)
41. Fire
Chapter Editor: Casey C. Grant
Table of Contents
Figures and Tables
Basic Concepts
Dougal Drysdale
Sources of Fire Hazards
Tamás Bánky
Fire Prevention Measures
Peter F. Johnson
Passive Fire Protection Measures
Yngve Anderberg
Active Fire Protection Measures
Gary Taylor
Organizing for Fire Protection
S. Dheri
Tables
Click a link below to view table in article context.
1. Lower & upper flammability limits in air
2. Flashpoints & firepoints of liquid & solid fuels
3. Ignition sources
4. Comparison of concentrations of different gases required for inerting
Figures
Point to a thumbnail to see figure caption, click to see figure in article context.


42. Heat and Cold (12)
42. Heat and Cold
Chapter Editor: Jean-Jacques Vogt
Table of Contents
Figures and Tables
Physiological Responses to the Thermal Environment
W. Larry Kenney
Effects of Heat Stress and Work in the Heat
Bodil Nielsen
Heat Disorders
Tokuo Ogawa
Prevention of Heat Stress
Sarah A. Nunneley
The Physical Basis of Work in Heat
Jacques Malchaire
Assessment of Heat Stress and Heat Stress Indices
Kenneth C. Parsons
Case Study: Heat Indices: Formulae and Definitions
Heat Exchange through Clothing
Wouter A. Lotens
Cold Environments and Cold Work
Ingvar Holmér, Per-Ola Granberg and Goran Dahlstrom
Prevention of Cold Stress in Extreme Outdoor Conditions
Jacques Bittel and Gustave Savourey
Cold Indices and Standards
Ingvar Holmér
Tables
Click a link below to view table in article context.
1. Electrolyte concentration in blood plasma & sweat
2. Heat Stress Index & Allowable Exposure Times: calculations
3. Interpretation of Heat Stress Index values
4. Reference values for criteria of thermal stress & strain
5. Model using heart rate to assess heat stress
6. WBGT reference values
7. Working practices for hot environments
8. Calculation of the SWreq index & assessment method: equations
9. Description of terms used in ISO 7933 (1989b)
10. WBGT values for four work phases
11. Basic data for the analytical assessment using ISO 7933
12. Analytical assessment using ISO 7933
13. Air temperatures of various cold occupational environments
14. Duration of uncompensated cold stress & associated reactions
15. Indication of anticipated effects of mild & severe cold exposure
16. Body tissue temperature & human physical performance
17. Human responses to cooling: Indicative reactions to hypothermia
18. Health recommendations for personnel exposed to cold stress
19. Conditioning programmes for workers exposed to cold
20. Prevention & alleviation of cold stress: strategies
21. Strategies & measures related to specific factors & equipment
22. General adaptational mechanisms to cold
23. Number of days when water temperature is below 15 ºC
24. Air temperatures of various cold occupational environments
25. Schematic classification of cold work
26. Classification of levels of metabolic rate
27. Examples of basic insulation values of clothing
28. Classification of thermal resistance to cooling of handwear
29. Classification of contact thermal resistance of handwear
30. Wind Chill Index, temperature & freezing time of exposed flesh
31. Cooling power of wind on exposed flesh
Figures
Point to a thumbnail to see figure caption, click to see figure in article context.
|
|


43. Hours of Work (1)
43. Hours of Work
Chapter Editor: Peter Knauth
Table of Contents
Hours of Work
Peter Knauth
Tables
Click a link below to view table in article context.
1. Time intervals from beginning shiftwork until three illnesses
2. Shiftwork & incidence of cardiovascular disorders
Figures
Point to a thumbnail to see figure caption, click to see figure in article context.


44. Indoor Air Quality (8)
44. Indoor Air Quality
Chapter Editor: Xavier Guardino Solá
Table of Contents
Figures and Tables
Indoor Air Quality: Introduction
Xavier Guardino Solá
Nature and Sources of Indoor Chemical Contaminants
Derrick Crump
Radon
María José Berenguer
Tobacco Smoke
Dietrich Hoffmann and Ernst L. Wynder
Smoking Regulations
Xavier Guardino Solá
Measuring and Assessing Chemical Pollutants
M. Gracia Rosell Farrás
Biological Contamination
Brian Flannigan
Regulations, Recommendations, Guidelines and Standards
María José Berenguer
Tables
Click a link below to view table in article context.
1. Classification of indoor organic pollutants
2. Formaldehyde emission from a variety of materials
3. Ttl. volatile organic comp’ds concs, wall/floor coverings
4. Consumer prods & other sources of volatile organic comp’ds
5. Major types & concentrations in the urban United Kingdom
6. Field measurements of nitrogen oxides & carbon monoxide
7. Toxic & tumorigenic agents in cigarette sidestream smoke
8. Toxic & tumorigenic agents from tobacco smoke
9. Urinary cotinine in non-smokers
10. Methodology for taking samples
11. Detection methods for gases in indoor air
12. Methods used for the analysis of chemical pollutants
13. Lower detection limits for some gases
14. Types of fungus which can cause rhinitis and/or asthma
15. Micro-organisms and extrinsic allergic alveolitis
16. Micro-organisms in nonindustrial indoor air & dust
17. Standards of air quality established by the US EPA
18. WHO guidelines for non-cancer and non-odour annoyance
19. WHO guideline values based on sensory effects or annoyance
20. Reference values for radon of three organizations
Figures
Point to a thumbnail to see figure caption, click to see figure in article context.
|
|


45. Indoor Environmental Control (6)
45. Indoor Environmental Control
Chapter Editor: Juan Guasch Farrás
Table of Contents
Figures and Tables
Control of Indoor Environments: General Principles
A. Hernández Calleja
Indoor Air: Methods for Control and Cleaning
E. Adán Liébana and A. Hernández Calleja
Aims and Principles of General and Dilution Ventilation
Emilio Castejón
Ventilation Criteria for Nonindustrial Buildings
A. Hernández Calleja
Heating and Air-Conditioning Systems
F. Ramos Pérez and J. Guasch Farrás
Indoor Air: Ionization
E. Adán Liébana and J. Guasch Farrás
Tables
Click a link below to view table in article context.
1. Most common indoor pollutants & their sources
2. Basic requirements-dilution ventilation system
3. Control measures & their effects
4. Adjustments to working environment & effects
5. Effectiveness of filters (ASHRAE standard 52-76)
6. Reagents used as absorbents for contaminents
7. Levels of quality of indoor air
8. Contamination due to the occupants of a building
9. Degree of occupancy of different buildings
10. Contamination due to the building
11. Quality levels of outside air
12. Proposed norms for environmental factors
13. Temperatures of thermal comfort (based on Fanger)
14. Characteristics of ions
Figures
Point to a thumbnail to see figure caption, click to see figure in article context.
|
|


46. Lighting (3)
46. Lighting
Chapter Editor: Juan Guasch Farrás
Table of Contents
Figures and Tables
Types of Lamps and Lighting
Richard Forster
Conditions Required for Visual
Fernando Ramos Pérez and Ana Hernández Calleja
General Lighting Conditions
N. Alan Smith
Tables
Click a link below to view table in article context.
1. Improved output & wattage of some 1,500 mm fluorescent tube lamps
2. Typical lamp efficacies
3. International Lamp Coding System (ILCOS) for some lamp types
4. Common colours & shapes of incandescent lamps & ILCOS codes
5. Types of high-pressure sodium lamp
6. Colour contrasts
7. Reflection factors of different colours & materials
8. Recommended levels of maintained illuminance for locations/tasks
Figures
Point to a thumbnail to see figure caption, click to see figure in article context.
|
|


47. Noise (5)
47. Noise
Chapter Editor: Alice H. Suter
Table of Contents
Figures and Tables
The Nature and Effects of Noise
Alice H. Suter
Noise Measurement and Exposure Evaluation
Eduard I. Denisov and German A. Suvorov
Engineering Noise Control
Dennis P. Driscoll
Hearing Conservation Programmes
Larry H. Royster and Julia Doswell Royster
Standards and Regulations
Alice H. Suter
Tables
Click a link below to view table in article context.
1. Permissible exposure limits (PEL)for noise exposure, by nation
Figures
Point to a thumbnail to see figure caption, click to see figure in article context.


48. Radiation: Ionizing (6)
48. Radiation: Ionizing
Chapter Editor: Robert N. Cherry, Jr.
Table of Contents
Introduction
Robert N. Cherry, Jr.
Radiation Biology and Biological Effects
Arthur C. Upton
Sources of Ionizing Radiation
Robert N. Cherry, Jr.
Workplace Design for Radiation Safety
Gordon M. Lodde
Radiation Safety
Robert N. Cherry, Jr.
Planning for and Management of Radiation Accidents
Sydney W. Porter, Jr.
49. Radiation, Non-Ionizing (9)
49. Radiation, Non-Ionizing
Chapter Editor: Bengt Knave
Table of Contents
Tables and Figures
Electric and Magnetic Fields and Health Outcomes
Bengt Knave
The Electromagnetic Spectrum: Basic Physical Characteristics
Kjell Hansson Mild
Ultraviolet Radiation
David H. Sliney
Infrared Radiation
R. Matthes
Light and Infrared Radiation
David H. Sliney
Lasers
David H. Sliney
Radiofrequency Fields and Microwaves
Kjell Hansson Mild
VLF and ELF Electric and Magnetic Fields
Michael H. Repacholi
Static Electric and Magnetic Fields
Martino Grandolfo
Tables
Click a link below to view table in article context.
1. Sources and exposures for IR
2. Retinal thermal hazard function
3. Exposure limits for typical lasers
4. Applications of equipment using range >0 to 30 kHz
5. Occupational sources of exposure to magnetic fields
6. Effects of currents passing through the human body
7. Biological effects of various current density ranges
8. Occupational exposure limits-electric/magnetic fields
9. Studies on animals exposed to static electric fields
10. Major technologies and large static magnetic fields
11. ICNIRP recommendations for static magnetic fields
Figures
Point to a thumbnail to see figure caption, click to see figure in article context.
|
|


50. Vibration (4)
50. Vibration
Chapter Editor: Michael J. Griffin
Table of Contents
Table and Figures
Vibration
Michael J. Griffin
Whole-body Vibration
Helmut Seidel and Michael J. Griffin
Hand-transmitted Vibration
Massimo Bovenzi
Motion Sickness
Alan J. Benson
Tables
Click a link below to view table in article context.
1. Activities with adverse effects of whole-body vibration
2. Preventive measures for whole-body vibration
3. Hand-transmitted vibration exposures
4. Stages, Stockholm Workshop scale, hand-arm vibration syndrome
5. Raynaud’s phenomenon & hand-arm vibration syndrome
6. Threshold limit values for hand-transmitted vibration
7. European Union Council Directive: Hand-transmitted vibration (1994)
8. Vibration magnitudes for finger blanching
Figures
Point to a thumbnail to see figure caption, click to see figure in article context.
|
|


51. Violence (1)
51. Violence
Chapter Editor: Leon J. Warshaw
Table of Contents
Violence in the Workplace
Leon J. Warshaw
Tables
Click a link below to view table in article context.
1. Highest rates of occupational homicide, US workplaces, 1980-1989
2. Highest rates of occupational homicide US occupations, 1980-1989
3. Risk factors for workplace homicides
4. Guides for programmes to prevent workplace violence
52. Visual Display Units (11)
52. Visual Display Units
Chapter Editor: Diane Berthelette
Table of Contents
Tables and Figures
Overview
Diane Berthelette
Characteristics of Visual Display Workstations
Ahmet Çakir
Ocular and Visual Problems
Paule Rey and Jean-Jacques Meyer
Reproductive Hazards - Experimental Data
Ulf Bergqvist
Reproductive Effects - Human Evidence
Claire Infante-Rivard
Case Study: A Summary of Studies of Reproductive Outcomes
Musculoskeletal Disorders
Gabriele Bammer
Skin Problems
Mats Berg and Sture Lidén
Psychosocial Aspects of VDU Work
Michael J. Smith and Pascale Carayon
Ergonomic Aspects of Human - Computer Interaction
Jean-Marc Robert
Ergonomics Standards
Tom F.M. Stewart
Tables
Click a link below to view table in article context.
1. Distribution of computers in various regions
2. Frequency & importance of elements of equipment
3. Prevalence of ocular symptoms
4. Teratological studies with rats or mice
5. Teratological studies with rats or mice
6. VDU use as a factor in adverse pregnancy outcomes
7. Analyses to study causes musculoskeletal problems
8. Factors thought to cause musculoskeletal problems
Figures
Point to a thumbnail to see figure caption, click to see figure in article context.
|
|


Heating and Air-Conditioning Systems
With regard to heating, a given person’s needs will depend on many factors. They can be classified into two main groups, those related to the surroundings and those related to human factors. Among those related to the surroundings one might count geography (latitude and altitude), climate, the type of exposure of the space the person is in, or the barriers that protect the space against the external environment, etc. Among the human factors are the worker’s energy consumption, the pace of work or the amount of exertion needed for the job, the clothing or garments used against the cold and personal preferences or tastes.
The need for heating is seasonal in many regions, but this does not mean that heating is dispensable during the cold season. Cold environmental conditions affect health, mental and physical efficiency, precision and occasionally may increase the risk of accidents. The goal of a heating system is to maintain pleasant thermal conditions that will prevent or minimize adverse health effects.
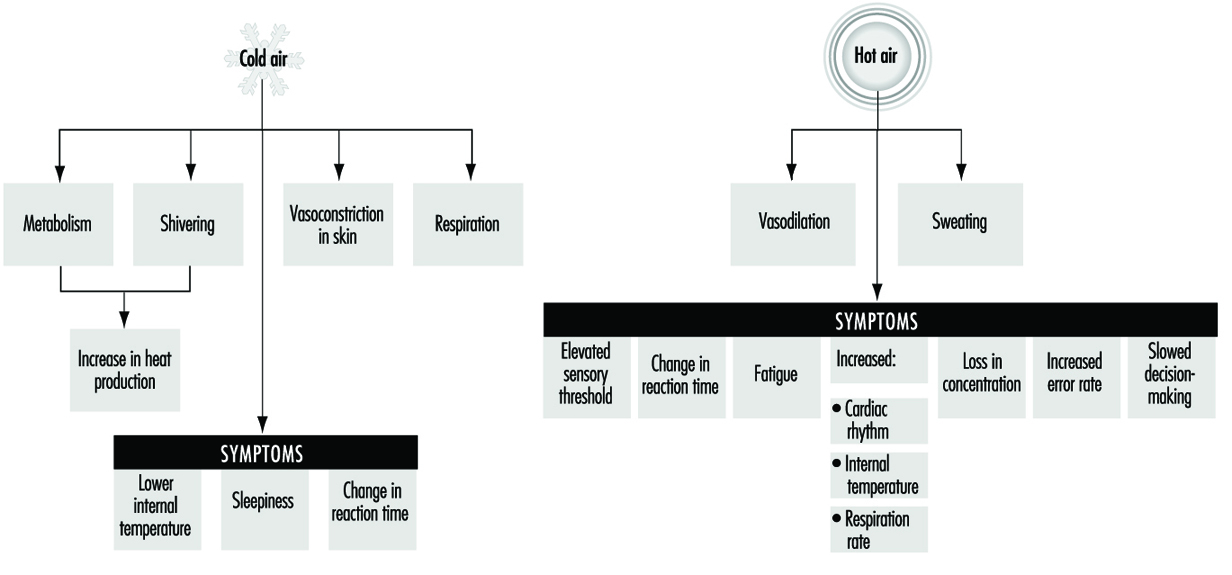
The physiological characteristics of the human body allow it to withstand great variations in thermal conditions. Human beings maintain their thermal balance through the hypothalamus, by means of thermal receptors in the skin; body temperature is kept between 36 and 38°C as shown in figure 1.
Figure 1. Thermoregulatory mechanisms in human beings
Heating systems need to have very precise control mechanisms, especially in cases where workers carry out their tasks in a sitting or a fixed position that does not stimulate blood circulation to their extremities. Where the work performed allows a certain mobility, the control of the system may be somewhat less precise. Finally, where the work performed takes place in abnormally adverse conditions, as in refrigerated chambers or in very cold climatic conditions, support measures may be undertaken to protect special tissues, to regulate the time spent under those conditions or to supply heat by electrical systems incorporated into the worker’s garments.
Definition and Description of the Thermal Environment
A requirement that can be demanded of any properly functioning heating or air conditioning system is that it should allow for control of the variables that define the thermal environment, within specified limits, for each season of the year. These variables are
- air temperature
- average temperature of the inside surfaces that define the space
- air humidity
- speeds and uniformity of speeds of air flow within the space
It has been shown that there is a very simple relation between the temperature of the air and of the wall surfaces of a given space, and the temperatures that provide the same perceived thermal sensation in a different room. This relation can be expressed as
![]()
where
Teat = equivalent air temperature for a given thermal sensation
Tdbt = air temperature measured with a dry bulb thermometer
Tast = measured average surface temperature of the walls.
For example, if in a given space the air and the walls are at 20° C, the equivalent temperature will be 20°C, and the perceived sensation of heat will be the same as in a room where the average temperature of the walls is 15°C and the air temperature is 25°C, because that room would have the same equivalent temperature. From the standpoint of temperature, the perceived sensation of thermal comfort would be the same.
Properties of humid air
In implementing an air-conditioning plan, three things that must be taken into consideration are the thermodynamic state of the air in the given space, of the air outside, and of the air that will be supplied to the room. The selection of a system capable of transforming the thermodynamic properties of the air supplied to the room will then be based on the existing thermal loads of each component. We therefore need to know the thermodynamic properties of humid air. They are as follows:
Tdbt = the dry bulb temperature reading, measured with a thermometer insulated from radiated heat
Tdpt = the dew point temperature reading. This is the temperature at which nonsaturated dry air reaches the saturation point
W = a humidity relation that ranges from zero for dry air to Ws for saturated air. It is expressed as kg of water vapour by kg of dry air
RH = relative humidity
t* = thermodynamic temperature with moist bulb
v = specific volume of air and water vapour (expressed in units of m3/kg). It is the inverse of density
H = enthalpy, kcal/kg of dry air and associated water vapour.
Of the above variables, only three are directly measurable. They are the dry bulb temperature reading, the dew point temperature reading and relative humidity. There is a fourth variable that is experimentally measurable, defined as the wet bulb temperature. The wet bulb temperature is measured with a thermometer whose bulb has been moistened and which is moved, typically with the aid of a sling, through nonsaturated moist air at a moderate speed. This variable differs by an insignificant amount from the thermodynamic temperature with a dry bulb (3 per cent), so they can both be used for calculations without erring too much.
Psychrometric diagram
The properties defined in the previous section are functionally related and can be portrayed in graphic form. This graphic representation is called a psychrometric diagram. It is a simplified graph derived from tables of the American Society of Heating, Refrigerating and Air Conditioning Engineers (ASHRAE). Enthalpy and the degree of humidity are shown on the coordinates of the diagram; the lines drawn show dry and humid temperatures, relative humidity and specific volume. With the psychrometric diagram, knowing any two of the aforementioned variables enables you to derive all the properties of humid air.
Conditions for thermal comfort
Thermal comfort is defined as a state of mind that expresses satisfaction with the thermal environment. It is influenced by physical and physiological factors.
It is difficult to prescribe general conditions that should be met for thermal comfort because conditions differ in various work situations; different conditions could even be required for the same work post when it is occupied by different people. A technical norm for thermal conditions required for comfort cannot be applied to all countries because of the different climatic conditions and their different customs governing dress.
Studies have been carried out with workers that do light manual labour, establishing a series of criteria for temperature, speed and humidity that are shown in table 1 (Bedford and Chrenko 1974).
Table 1. Proposed norms for environmental factors
|
Environmental factor |
Proposed norm |
|
Air temperature |
21 °C |
|
Average radiant temperature |
≥ 21 °C |
|
Relative humidity |
30–70% |
|
Speed of air flow |
0.05–0.1 metre/second |
|
Temperature gradient (from head to foot) |
≤ 2.5 °C |
The above factors are interrelated, requiring a lower air temperature in cases where there is high thermal radiation and requiring a higher air temperature when the speed of the air flow is also higher.
Generally, the corrections that should be carried out are the following:
The air temperature should be increased:
- if the speed of the air flow is high
- for sedentary work situations
- if clothing used is light
- when people must be acclimatized to high indoor temperatures.
The air temperature should be decreased:
- if the work involves heavy manual labour
- when warm clothing is used.
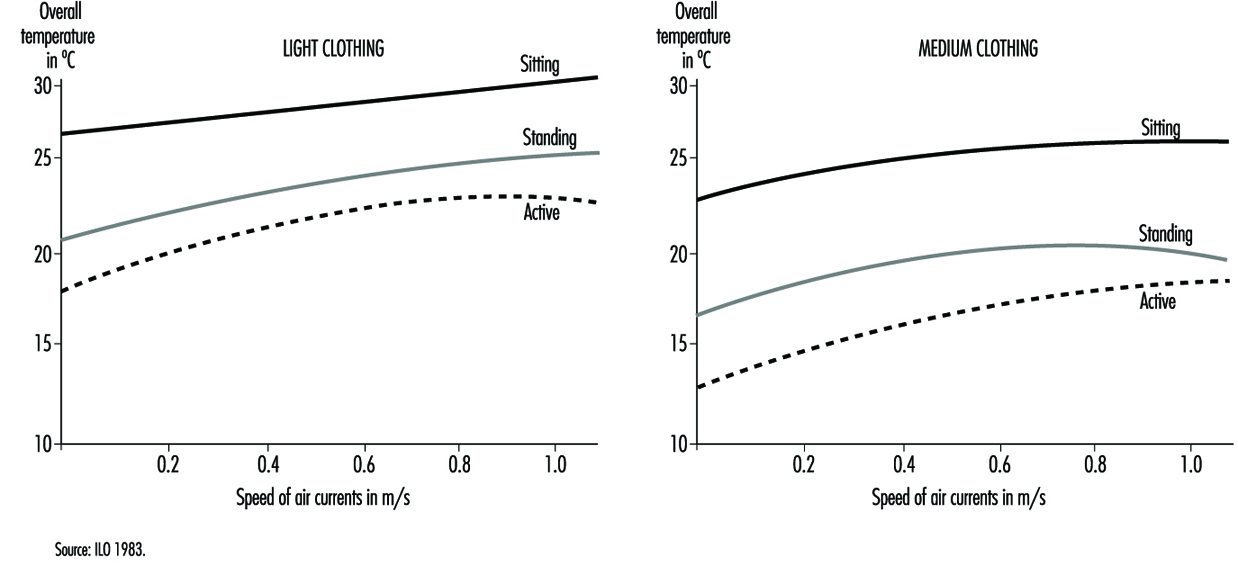
For a good sensation of thermal comfort the most desirable situation is one where the temperature of the environment is slightly higher than the temperature of the air, and where the flow of radiating thermal energy is the same in all directions and is not excessive overhead. The increase in temperature by height should be minimized, keeping feet warm without creating too much of a thermal load overhead. An important factor that has a bearing on the sensation of thermal comfort is the speed of the air flow. There are diagrams that give recommended air speeds as a function of the activity that is being carried out and the kind of clothing used (figure 2).
Figure 2. Comfort zones based on readings of overall temperatures and speed of air currents
In some countries there are norms for minimal environmental temperatures, but optimal values have not yet been established. Typically, the maximum value for air temperature is given as 20°C. With recent technical improvements, the complexity of measuring thermal comfort has increased. Many indexes have appeared, including the index of effective temperature (ET) and the index of effective temperature, corrected (CET); the index of caloric overload; the Heat Stress Index (HSI); the wet bulb globe temperature (WBGT); and the Fanger index of median values (IMV), among others. The WBGT index allows us to determine the intervals of rest required as a function of the intensity of the work performed so as to preclude thermal stress under working conditions. This is discussed more fully in the chapter Heat and Cold.
Thermal comfort zone in a psychrometric diagram
The range on the psychrometric diagram corresponding to conditions under which an adult perceives thermal comfort has been carefully studied and has been defined in the ASHRAE norm based on the effective temperature, defined as the temperature measured with a dry bulb thermometer in a uniform room with 50 per cent relative humidity, where people would have the same interchange of heat by radiant energy, convection and evaporation as they would with the level of humidity in the given local environment. The scale of effective temperature is defined by ASHRAE for a level of clothing of 0.6 clo—clo is a unit of insulation; 1 clo corresponds to the insulation provided by a normal set of clothes—that assumes a level of thermal insulation of 0.155 K m2W–1, where K is the exchange of heat by conduction measured in Watts per square metre (W m–2) for a movement of air of 0.2 m s–1 (at rest), for an exposure of one hour at a chosen sedentary activity of 1 met (unit of metabolic rate=50 Kcal/m2h). This comfort zone is seen in figure 2 and can be used for thermal environments where the measured temperature from radiant heat is approximately the same as the temperature measured by a dry bulb thermometer, and where the speed of air flow is below 0.2 m s–1 for people dressed in light clothing and carrying out sedentary activities.
Comfort formula: The Fanger method
The method developed by PO Fanger is based on a formula that relates variables of ambient temperature, average radiant temperature, relative speed of air flow, pressure of water vapour in ambient air, level of activity and thermal resistance of the clothing worn. An example derived from the comfort formula is shown in table 2, which can be used in practical applications for obtaining a comfortable temperature as a function of the clothing worn, the metabolic rate of the activity carried out and the speed of the air flow.
Table 2. Temperatures of thermal comfort (°C), at 50% relative humidity (based on the formula by PO Fanger)
|
Metabolism (Watts) |
105 |
|||
|
Radiating temperature |
clo |
20 °C |
25 °C |
30 °C |
|
Clothing (clo) |
|
|
|
|
|
0.5 |
30.5 |
29.0 |
27.0 |
|
|
1.5 |
30.6 |
29.5 |
28.3 |
|
|
Clothing (clo) |
|
|
|
|
|
0.5 |
26.7 |
24.3 |
22.7 |
|
|
1.5 |
27.0 |
25.7 |
24.5 |
|
|
Metabolism (Watts) |
157 |
|||
|
Radiating temperature |
clo |
20 °C |
25 °C |
30 °C |
|
Clothing (clo) |
|
|
|
|
|
0.5 |
23.0 |
20.7 |
18.3 |
|
|
1.5 |
23.5 |
23.3 |
22.0 |
|
|
Clothing (clo) |
|
|
|
|
|
0.5 |
16.0 |
14.0 |
11.5 |
|
|
1.5 |
18.3 |
17.0 |
15.7 |
|
|
Metabolism (Watts) |
210 |
|||
|
Radiating temperature |
clo |
20 °C |
25 °C |
30 °C |
|
Clothing (clo) |
|
|
|
|
|
0.5 |
15.0 |
13.0 |
7.4 |
|
|
1.5 |
18.3 |
17.0 |
16.0 |
|
|
Clothing (clo) |
|
|
|
|
|
0.5 |
–1.5 |
–3.0 |
/ |
|
|
1.5 |
–5.0 |
2.0 |
1.0 |
|
Heating Systems
The design of any heating system should be directly related to the work to be performed and the characteristics of the building where it will be installed. It is hard to find, in the case of industrial buildings, projects where the heating needs of the workers are considered, often because the processes and workstations have yet to be defined. Normally systems are designed with a very free range, considering only the thermal loads that will exist in the building and the amount of heat that needs to be supplied to maintain a given temperature within the building, without regard to heat distribution, the situation of workstations and other similarly less general factors. This leads to deficiencies in the design of certain buildings that translate into shortcomings like cold spots, draughts, an insufficient number of heating elements and other problems.
To end up with a good heating system in planning a building, the following are some of the considerations that should be addressed:
- Consider the proper placement of insulation to save energy and to minimize temperature gradients within the building.
- Reduce as much as possible the infiltration of cold air into the building to minimize temperature variations in the work areas.
- Control air pollution through localized extraction of air and ventilation by displacement or diffusion.
- Control the emissions of heat due to the processes used in the building and their distribution in occupied areas of the building.
When heating is provided by burners without exhaust chimneys, special consideration should be given to the inhalation of the products of combustion. Normally, when the combustible materials are heating oil, gas or coke, they produce sulphur dioxide, nitrogen oxides, carbon monoxide and other combustion products. There exist human exposure limits for these compounds and they should be controlled, especially in closed spaces where the concentration of these gases can increase rapidly and the efficiency of the combustion reaction can decrease.
Planning a heating system always entails balancing various considerations, such as a low initial cost, flexibility of the service, energy efficiency and applicability. Therefore, the use of electricity during off-peak hours when it might be cheaper, for example, could make electric heaters cost-effective. The use of chemical systems for heat storage that can then be put to use during peak demand (using sodium sulphide, for example) is another option. It is also possible to study the placement of several different systems together, making them work in such a way that costs can be optimized.
The installation of heaters that are capable of using gas or heating oil is especially interesting. The direct use of electricity means consuming first-class energy that may turn out to be costly in many cases, but that may afford the needed flexibility under certain circumstances. Heat pumps and other cogeneration systems that take advantage of residual heat can afford solutions that may be very advantageous from the financial point of view. The problem with these systems is their high initial cost.
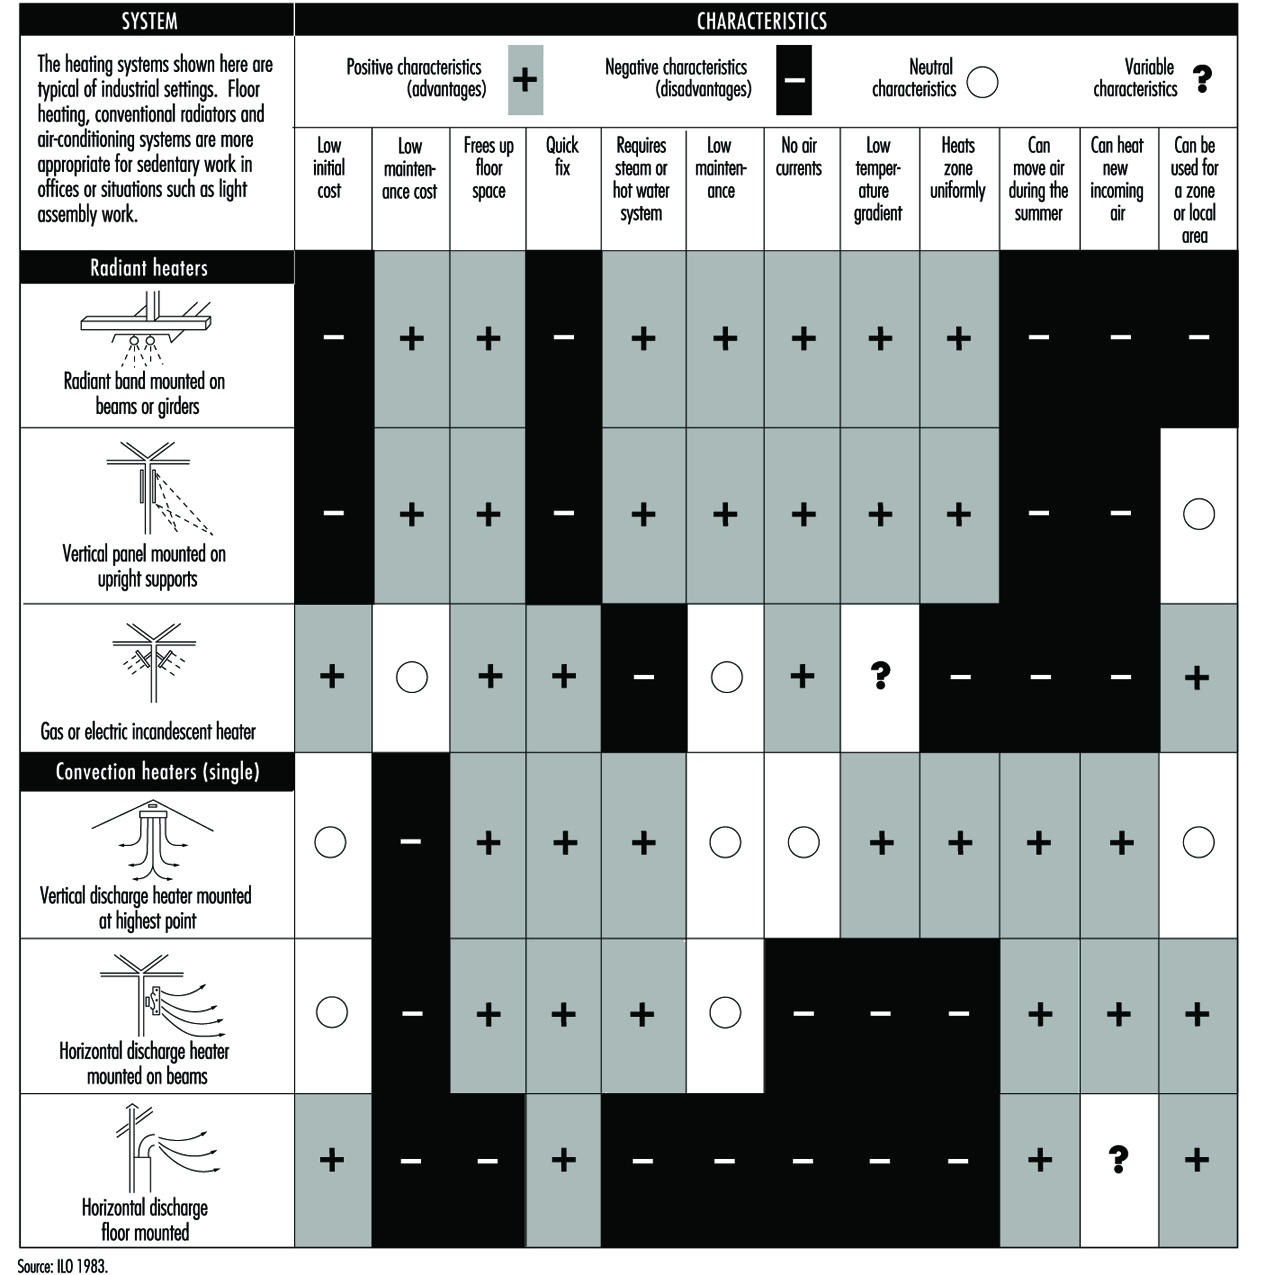
Today the tendency of heating and air conditioning systems is to aim to deliver optimal functioning and energy savings. New systems therefore include sensors and controls distributed throughout the spaces to be heated, obtaining a supply of heat only during the times necessary to obtain thermal comfort. These systems can save up to 30% of the energy costs of heating. Figure 3 shows some of the heating systems available, indicating their positive characteristics and their drawbacks.
Figure 3. Characteristics of the most common heating systems employed in worksites
Air-conditioning systems
Experience shows that industrial environments that are close to the comfort zone during summer months increase productivity, tend to register fewer accidents, have lower absenteeism and, in general, contribute to improved human relations. In the case of retail establishments, hospitals and buildings with large surfaces, air conditioning usually needs to be directed to be able to provide thermal comfort when outside conditions require it.
In certain industrial environments where external conditions are very severe, the goal of heating systems is geared more to providing enough heat to prevent possible adverse health effects than to providing enough heat for a comfortable thermal environment. Factors that should be carefully monitored are the maintenance and proper use of the air-conditioning equipment, especially when equipped with humidifiers, because they can become sources of microbial contamination with the risks that these contaminants may pose to human health.
Today ventilation and climate-control systems tend to cover, jointly and often using the same installation, the needs for heating, refrigerating and conditioning the air of a building. Multiple classifications may be used for refrigerating systems.
Depending on the configuration of the system they may be classified in the following way:
- Hermetically sealed units, with refrigerating fluid installed at the factory, that can be opened and recharged in a repair shop. These are air-conditioning units normally used in offices, dwellings and the like.
- Semi-hermetic units of medium size, factory made, that are of larger size than home units and that can be repaired through openings designed for that purpose.
- Segmented systems for warehouses and large surfaces, which consist of parts and components that are clearly differentiated and physically separate (the compressor and the condenser are physically separate from the evaporator and the expansion valve). They are used for large office buildings, hotels, hospitals, large factories and industrial buildings.
Depending on the coverage they provide, they can be classified in the following way:
- Systems for a single zone: one air treatment unit serves various rooms in the same building and at the same time. The rooms served have similar heating, refrigeration and ventilation needs and they are regulated by a common control (a thermostat or similar device). Systems of this type can end up being unable to supply an adequate level of comfort to each room if the design plan did not take into consideration the different thermal loads between rooms in the same zone. This may happen when there is an increase in the occupancy of a room or when lighting or other heat sources are added, like computers or copying machines, that were unforeseen during the original design of the system. Discomfort may also occur because of seasonal changes in the amount of solar radiation a room receives, or even because of the changes from one room to the next during the day.
- Systems for multiple zones: systems of this type can provide different zones with air at different temperatures and humidities by heating, cooling, humidifying or dehumidifying air in each zone and by varying the flow of air. These systems, even if they generally have a common and centralized air cooling unit (compressor, evaporator, etc.), are equipped with a variety of elements, such as devices that control the flow of air, heating coils and humidifiers. These systems are capable of adjusting the conditions of a room based on specific thermal loads, which they detect by means of sensors distributed in the rooms throughout the area they serve.
- Depending on the flow of air that these systems pump into the building they are classified in the following way:
- Constant volume (CV): these systems pump a constant flow of air into each room. Temperature changes are effected by heating or cooling the air. These systems frequently mix a percentage of outside air with recycled indoor air.
- Variable volume (VAV): these systems maintain thermal comfort by varying the amount of heated or cooled air supplied to each space. Even though they function primarily based on this mixing principle, they can also be combined with systems that change the temperature of the air they introduce into the room.
The problems that most frequently plague these types of systems are excess heating or cooling if the system is not adjusted to respond to variations in thermal loads, or a lack of ventilation if the system does not introduce a minimal amount of outside air to renew the circulating indoor air. This creates stale indoor environments in which the quality of air deteriorates.
The basic elements of all air-conditioning systems are (see also figure 4):
- Units to retain solid matter, usually bag filters or electrostatic precipitators.
- Air heating or cooling units: heat is exchanged in these units by thermal exchange with cold water or refrigerating liquids, by forced ventilation in the summer and by heating with electrical coils or by combustion in the winter.
- Units to control humidity: in winter humidity can be added by directly injecting water vapour or by direct water evaporation; in the summer it can be removed by refrigerated coils that condense excess humidity in the air, or by a refrigerated water system in which moist air flows through a curtain of drops of water that is colder than the dew point of the moist air.
Figure 4. Simplified schematic of air-conditioning system

Indoor Air: Ionization
Ionization is one of the techniques used to eliminate particulate matter from air. Ions act as condensation nuclei for small particles which, as they stick together, grow and precipitate.
The concentration of ions in closed indoor spaces is, as a general rule and if there are no additional sources of ions, inferior to that of open spaces. Hence the belief that increasing the concentration of negative ions in indoor air improves air quality.
Some studies based on epidemiological data and on planned experimental research assert that increasing the concentration of negative ions in work environments leads to improved worker efficiency and enhances the mood of employees, while positive ions have an adverse affect. However, parallel studies show that existing data on the effects of negative ionization on workers’ productivity are inconsistent and contradictory. Therefore, it seems that it is still not possible to assert unequivocally that the generation of negative ions is really beneficial.
Natural Ionization
Individual gas molecules in the atmosphere can ionize negatively by gaining, or positively by losing, an electron. For this to occur a given molecule must first gain enough energy—usually called the ionization energy of that particular molecule. Many sources of energy, both of cosmic and terrestrial origin, occur in nature that are capable of producing this phenomenon: background radiation in the atmosphere; electromagnetic solar waves (especially ultraviolet ones), cosmic rays, atomization of liquids such as the spray caused by waterfalls, the movement of great masses of air over the earth’s surface, electrical phenomena such as lightning and storms, the process of combustion and radioactive substances.
The electrical configurations of the ions that are formed this way, while not completely known yet, seems to include the ions of carbonation and H+, H3O+, O+, N+, OH–, H2O– and O2–. These ionized molecules can aggregate through adsorption on suspended particles (fog, silica and other contaminants). Ions are classified according to their size and their mobility. The latter is defined as a velocity in an electrical field expressed as a unit such as centimetres per second by voltage per centimetre (cm/s/V/cm), or, more compactly,
![]()
Atmospheric ions tend to disappear by recombination. Their half-life depends on their size and is inversely proportional to their mobility. Negative ions are statistically smaller and their half-life is of several minutes, while positive ions are larger and their half-life is about one half hour. The spatial charge is the quotient of the concentration of positive ions and the concentration of negative ions. The value of this relation is greater than one and depends on factors such as climate, location and season of the year. In living spaces this coefficient can have values that are lower than one. Characteristics are given in table 1.
Table 1. Characteristics of ions of given mobilities and diameter
|
Mobility (cm2/Vs) |
Diameter (mm) |
Characteristics |
|
3.0–0.1 |
0.001–0.003 |
Small, high mobility, short life |
|
0.1–0.005 |
0.003–0.03 |
Intermediate, slower than small ions |
|
0.005–0.002 |
>0.03 |
Slow ions, aggregates on particulate matter |
Artificial Ionization
Human activity modifies the natural ionization of air. Artificial ionization can be caused by industrial and nuclear processes and fires. Particulate matter suspended in air favours the formation of Langevin ions (ions aggregated on particulate matter). Electrical radiators increase the concentration of positive ions considerably. Air-conditioners also increase the spatial charge of indoor air.
Workplaces have machinery that produces positive and negative ions simultaneously, as in the case of machines that are important local sources of mechanical energy (presses, spinning and weaving machines), electrical energy (motors, electronic printers, copiers, high-voltage lines and installations), electromagnetic energy (cathode-ray screens, televisions, computer monitors) or radioactive energy (cobalt-42 therapy). These kinds of equipment create environments with higher concentrations of positive ions due to the latter’s higher half-life as compared to negative ions.
Environmental Concentrations of Ions
Concentrations of ions vary with environmental and meteorological conditions. In areas with little pollution, such as in forests and mountains, or at great altitudes, the concentration of small ions grows; in areas close to radioactive sources, waterfalls, or river rapids the concentrations can reach thousands of small ions per cubic centimetre. In the proximity of the sea and when the levels of humidity are high, on the other hand, there is an excess of large ions. In general, the average concentration of negative and positive ions in clean air is 500 and 600 ions per cubic centimetre respectively.
Some winds can carry great concentrations of positive ions—the Föhn in Switzerland, the Santa Ana in the United States, the Sirocco in North Africa, the Chinook in the Rocky Mountains and the Sharav in the Middle East.
In workplaces where there are no significant ionizing factors there is often an accumulation of large ions. This is especially true, for example, in places that are hermetically sealed and in mines. The concentration of negative ions decreases significantly in indoor spaces and in contaminated areas or areas that are dusty. There are many reasons why the concentration of negative ions also decreases in indoor spaces that have air-conditioning systems. One reason is that negative ions remain trapped in air ducts and air filters or are attracted to surfaces that are positively charged. Cathode-ray screens and computer monitors, for example, are positively charged, creating in their immediate vicinity a microclimate deficient in negative ions. Air filtration systems designed for “clean rooms” that require that levels of contamination with particulate matter be kept at a very low minimum seem also to eliminate negative ions.
On the other hand, an excess of humidity condenses ions, while a lack of it creates dry environments with large amounts of electrostatic charges. These electrostatic charges accumulate in plastic and synthetic fibres, both in the room and on people.
Ion Generators
Generators ionize air by delivering a large amount of energy. This energy may come from a source of alpha radiation (such as tritium) or from a source of electricity by the application of a high voltage to a sharply pointed electrode. Radioactive sources are forbidden in most countries because of the secondary problems of radioactivity.
Electric generators are made of a pointed electrode surrounded by a crown; the electrode is supplied with a negative voltage of thousands of volts, and the crown is grounded. Negative ions are expelled while positive ions are attracted to the generator. The amount of negative ions generated increases in proportion to the voltage applied and to the number of electrodes that it contains. Generators that have a greater number of electrodes and use a lower voltage are safer, because when voltage exceeds 8,000 to 10,000 volts the generator will produce not only ions, but also ozone and some nitrous oxides. The dissemination of ions is achieved by electrostatic repulsion.
The migration of ions will depend on the alignment of the magnetic field generated between the emission point and the objects that surround it. The concentration of ions surrounding the generators is not homogeneous and diminishes significantly as the distance from them increases. Fans installed in this equipment will increase the ionic dispersion zone. It is important to remember that the active elements of the generators need to be cleaned periodically to insure proper functioning.
The generators may also be based on atomizing water, on thermoelectric effects or on ultraviolet rays. There are many different types and sizes of generators. They may be installed on ceilings and walls or may be placed anywhere if they are the small, portable type.
Measuring Ions
Ion measuring devices are made by placing two conductive plates 0.75 cm apart and applying a variable voltage. Collected ions are measured by a picoamperemeter and the intensity of the current is registered. Variable voltages permit the measurement of concentrations of ions with different mobilities. The concentration of ions (N) is calculated from the intensity of the electrical current generated using the following formula:
![]()
where I is the current in amperes, V is the speed of the air flow, q is the charge of a univalent ion (1.6x10⁻¹⁹) in Coulombs and A is the effective area of the collector plates. It is assumed that all ions have a single charge and that they are all retained in the collector. It should be kept in mind that this method has its limitations due to background current and the influence of other factors such as humidity and fields of static electricity.
The Effects of Ions on the Body
Small negative ions are the ones which are supposed to have the greatest biological effect because of their greater mobility. High concentrations of negative ions can kill or block the growth of microscopic pathogens, but no adverse effects on humans have been described.
Some studies suggest that exposure to high concentrations of negative ions produces biochemical and physiological changes in some people that have a relaxing effect, reduce tension and headaches, improve alertness and cut reaction time. These effects could be due to the suppression of the neural hormone serotonin (5-HT) and of histamine in environments loaded with negative ions; these factors could affect a hypersensitive segment of the population. However, other studies reach different conclusions on the effects of negative ions on the body. Therefore, the benefits of negative ionization are still open to debate and further study is needed before the matter is decided.
Types of Lamps and Lighting
A lamp is an energy converter. Although it may carry out secondary functions, its prime purpose is the transformation of electrical energy into visible electromagnetic radiation. There are many ways to create light. The standard method for creating general lighting is the conversion of electrical energy into light.
Types of Light
Incandescence
When solids and liquids are heated, they emit visible radiation at temperatures above 1,000 K; this is known as incandescence.
Such heating is the basis of light generation in filament lamps: an electrical current passes through a thin tungsten wire, whose temperature rises to around 2,500 to 3,200 K, depending upon the type of lamp and its application.
There is a limit to this method, which is described by Planck’s Law for the performance of a black body radiator, according to which the spectral distribution of energy radiated increases with temperature. At about 3,600 K and above, there is a marked gain in emission of visible radiation, and the wavelength of maximum power shifts into the visible band. This temperature is close to the melting point of tungsten, which is used for the filament, so the practical temperature limit is around 2,700 K, above which filament evaporation becomes excessive. One result of these spectral shifts is that a large part of the radiation emitted is not given off as light but as heat in the infrared region. Filament lamps can thus be effective heating devices and are used in lamps designed for print drying, food preparation and animal rearing.
Electric discharge
Electrical discharge is a technique used in modern light sources for commerce and industry because of the more efficient production of light. Some lamp types combine the electrical discharge with photoluminescence.
An electric current passed through a gas will excite the atoms and molecules to emit radiation of a spectrum which is characteristic of the elements present. Two metals are commonly used, sodium and mercury, because their characteristics give useful radiations within the visible spectrum. Neither metal emits a continuous spectrum, and discharge lamps have selective spectra. Their colour rendering will never be identical to continuous spectra. Discharge lamps are often classed as high pressure or low pressure, although these terms are only relative, and a high-pressure sodium lamp operates at below one atmosphere.
Types of Luminescence
Photoluminescence occurs when radiation is absorbed by a solid and is then re-emitted at a different wavelength. When the re-emitted radiation is within the visible spectrum the process is called fluorescence or phosphorescence.
Electroluminescence occurs when light is generated by an electric current passed through certain solids, such as phosphor materials. It is used for self-illuminated signs and instrument panels but has not proved to be a practical light source for the lighting of buildings or exteriors.
Evolution of Electric Lamps
Although technological progress has enabled different lamps to be produced, the main factors influencing their development have been external market forces. For example, the production of filament lamps in use at the start of this century was possible only after the availability of good vacuum pumps and the drawing of tungsten wire. However, it was the large-scale generation and distribution of electricity to meet the demand for electric lighting that determined market growth. Electric lighting offered many advantages over gas- or oil-generated light, such as steady light that requires infrequent maintenance as well as the increased safety of having no exposed flame, and no local by-products of combustion.
During the period of recovery after the Second World War, the emphasis was on productivity. The fluorescent tubular lamp became the dominant light source because it made possible the shadow-free and comparatively heat-free lighting of factories and offices, allowing maximum use of the space. The light output and wattage requirements for a typical 1,500 mm fluorescent tubular lamp is given in table 1.
Table 1. Improved light output and wattage requirements of some typical 1,500 mm fluorescent tube lamps
|
Rating (W) |
Diameter (mm) |
Gas fill |
Light output (lumens) |
|
80 |
38 |
argon |
4,800 |
|
65 |
38 |
argon |
4,900 |
|
58 |
25 |
krypton |
5,100 |
|
50 |
25 |
argon |
5,100 |
By the 1970s oil prices rose and energy costs became a significant part of operating costs. Fluorescent lamps that produce the same amount of light with less electrical consumption were demanded by the market. Lamp design was refined in several ways. As the century closes there is a growing awareness of global environment issues. Better use of declining raw materials, recycling or safe disposal of products and the continuing concern over energy consumption (particularly energy generated from fossil fuels) are impacting on current lamp designs.
Performance Criteria
Performance criteria vary by application. In general, there is no particular hierarchy of importance of these criteria.
Light output: The lumen output of a lamp will determine its suitability in relation to the scale of the installation and the quantity of illumination required.
Colour appearance and colour rendering: Separate scales and numerical values apply to colour appearance and colour rendering. It is important to remember that the figures provide guidance only, and some are only approximations. Whenever possible, assessments of suitability should be made with actual lamps and with the colours or materials that apply to the situation.
Lamp life: Most lamps will require replacement several times during the life of the lighting installation, and designers should minimize the inconvenience to the occupants of odd failures and maintenance. Lamps are used in a wide variety of applications. The anticipated average life is often a compromise between cost and performance. For example, the lamp for a slide projector will have a life of a few hundred hours because the maximum light output is important to the quality of the image. By contrast, some roadway lighting lamps may be changed every two years, and this represents some 8,000 burning hours.
Further, lamp life is affected by operating conditions, and thus there is no simple figure that will apply in all conditions. Also, the effective lamp life may be determined by different failure modes. Physical failure such as filament or lamp rupture may be preceded by reduction in light output or changes in colour appearance. Lamp life is affected by external environmental conditions such as temperature, vibration, frequency of starting, supply voltage fluctuations, orientation and so on.
It should be noted that the average life quoted for a lamp type is the time for 50% failures from a batch of test lamps. This definition of life is not likely to be applicable to many commercial or industrial installations; thus practical lamp life is usually less than published values, which should be used for comparison only.
Efficiency: As a general rule the efficiency of a given type of lamp improves as the power rating increases, because most lamps have some fixed loss. However, different types of lamps have marked variation in efficiency. Lamps of the highest efficiency should be used, provided that the criteria of size, colour and lifetime are also met. Energy savings should not be at the expense of the visual comfort or the performance ability of the occupants. Some typical efficacies are given in table 2.
Table 2. Typical lamp efficacies
|
Lamp efficacies |
|
|
100 W filament lamp |
14 lumens/watt |
|
58 W fluorescent tube |
89 lumens/watt |
|
400 W high-pressure sodium |
125 lumens/watt |
|
131 W low-pressure sodium |
198 lumens/watt |
Main lamp types
Over the years, several nomenclature systems have been developed by national and international standards and registers.
In 1993, the International Electrotechnical Commission (IEC) published a new International Lamp Coding System (ILCOS) intended to replace existing national and regional coding systems. A list of some ILCOS short form codes for various lamps is given in table 3.
Table 3. International Lamp Coding System (ILCOS) short form coding system for some lamp types
|
Type (code) |
Common ratings (watts) |
Colour rendering |
Colour temperature (K) |
Life (hours) |
|
Compact fluorescent lamps (FS) |
5–55 |
good |
2,700–5,000 |
5,000–10,000 |
|
High-pressure mercury lamps (QE) |
80–750 |
fair |
3,300–3,800 |
20,000 |
|
High-pressure sodium lamps (S-) |
50–1,000 |
poor to good |
2,000–2,500 |
6,000–24,000 |
|
Incandescent lamps (I) |
5–500 |
good |
2,700 |
1,000–3,000 |
|
Induction lamps (XF) |
23–85 |
good |
3,000–4,000 |
10,000–60,000 |
|
Low-pressure sodium lamps (LS) |
26–180 |
monochromatic yellow colour |
1,800 |
16,000 |
|
Low-voltage tungsten halogen lamps (HS) |
12–100 |
good |
3,000 |
2,000–5,000 |
|
Metal halide lamps (M-) |
35–2,000 |
good to excellent |
3,000–5,000 |
6,000–20,000 |
|
Tubular fluorescent lamps (FD) |
4–100 |
fair to good |
2,700–6,500 |
10,000–15,000 |
|
Tungsten halogen lamps (HS) |
100–2,000 |
good |
3,000 |
2,000–4,000 |
Incandescent lamps
These lamps use a tungsten filament in an inert gas or vacuum with a glass envelope. The inert gas suppresses tungsten evaporation and lessens the envelope blackening. There is a large variety of lamp shapes, which are largely decorative in appearance. The construction of a typical General Lighting Service (GLS) lamp is given in figure 1.
Figure 1. Construction of a GLS lamp

Incandescent lamps are also available with a wide range of colours and finishes. The ILCOS codes and some typical shapes include those shown in table 4.
Table 4. Common colours and shapes of incandescent lamps, with their ILCOS codes
|
Colour/Shape |
Code |
|
Clear |
/C |
|
Frosted |
/F |
|
White |
/W |
|
Red |
/R |
|
Blue |
/B |
|
Green |
/G |
|
Yellow |
/Y |
|
Pear shaped (GLS) |
IA |
|
Candle |
IB |
|
Conical |
IC |
|
Globular |
IG |
|
Mushroom |
IM |
Incandescent lamps are still popular for domestic lighting because of their low cost and compact size. However, for commercial and industrial lighting the low efficacy generates very high operating costs, so discharge lamps are the normal choice. A 100 W lamp has a typical efficacy of 14 lumens/watt compared with 96 lumens/watt for a 36 W fluorescent lamp.
Incandescent lamps are simple to dim by reducing the supply voltage, and are still used where dimming is a desired control feature.
The tungsten filament is a compact light source, easily focused by reflectors or lenses. Incandescent lamps are useful for display lighting where directional control is needed.
Tungsten halogen lamps
These are similar to incandescent lamps and produce light in the same manner from a tungsten filament. However the bulb contains halogen gas (bromine or iodine) which is active in controlling tungsten evaporation. See figure 2.
Figure 2. The halogen cycle
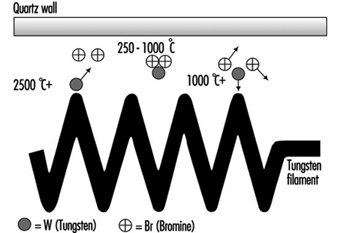
Fundamental to the halogen cycle is a minimum bulb wall temperature of 250 °C to ensure that the tungsten halide remains in a gaseous state and does not condense on the bulb wall. This temperature means bulbs made from quartz in place of glass. With quartz it is possible to reduce the bulb size.
Most tungsten halogen lamps have an improved life over incandescent equivalents and the filament is at a higher temperature, creating more light and whiter colour.
Tungsten halogen lamps have become popular where small size and high performance are the main requirement. Typical examples are stage lighting, including film and TV, where directional control and dimming are common requirements.
Low-voltage tungsten halogen lamps
These were originally designed for slide and film projectors. At 12 V the filament for the same wattage as 230 V becomes smaller and thicker. This can be more efficiently focused, and the larger filament mass allows a higher operating temperature, increasing light output. The thick filament is more robust. These benefits were realized as being useful for the commercial display market, and even though it is necessary to have a step-down transformer, these lamps now dominate shop-window lighting. See figure 3.
Figure 3. Low-voltage dichroic reflector lamp
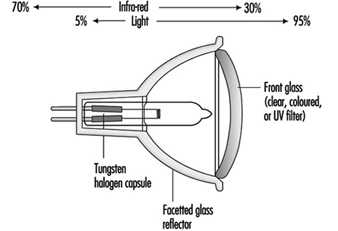
Although users of film projectors want as much light as possible, too much heat damages the transparency medium. A special type of reflector has been developed, which reflects only the visible radiation, allowing infrared radiation (heat) to pass through the back of lamp. This feature is now part of many low-voltage reflector lamps for display lighting as well as projector equipment.
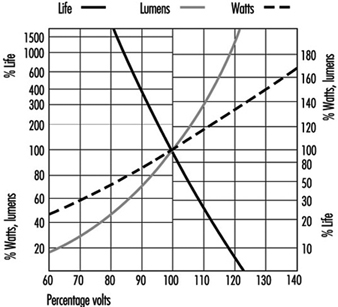
Voltage sensitivity: All filament lamps are sensitive to voltage variation, and light output and life are affected. The move to “harmonize” the supply voltage throughout Europe at 230 V is being achieved by widening the tolerances to which the generating authorities can operate. The move is towards ±10%, which is a voltage range of 207 to 253 V. Incandescent and tungsten halogen lamps cannot be operated sensibly over this range, so it will be necessary to match actual supply voltage to lamp ratings. See figure 4.
Figure 4. GLS filament lamps and supply voltage
Discharge lamps will also be affected by this wide voltage variation, so the correct specification of control gear becomes important.
Tubular fluorescent lamps
These are low pressure mercury lamps and are available as “hot cathode” and “cold cathode” versions. The former is the conventional fluorescent tube for offices and factories; “hot cathode” relates to the starting of the lamp by pre-heating the electrodes to create sufficient ionization of the gas and mercury vapour to establish the discharge.
Cold cathode lamps are mainly used for signage and advertising. See figure 5.
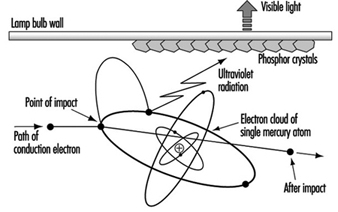
Figure 5. Principle of fluorescent lamp
Fluorescent lamps require external control gear for starting and to control the lamp current. In addition to the small amount of mercury vapour, there is a starting gas (argon or krypton).
The low pressure of mercury generates a discharge of pale blue light. The major part of the radiation is in the UV region at 254 nm, a characteristic radiation frequency for mercury. Inside of the tube wall is a thin phosphor coating, which absorbs the UV and radiates the energy as visible light. The colour quality of the light is determined by the phosphor coating. A range of phosphors are available of varying colour appearance and colour rendering.
During the 1950s phosphors available offered a choice of reasonable efficacy (60 lumens/watt) with light deficient in reds and blues, or improved colour rendering from “deluxe” phosphors of lower efficiency (40 lumens/watt).
By the 1970s new, narrow-band phosphors had been developed. These separately radiated red, blue and green light but, combined, produced white light. Adjusting the proportions gave a range of different colour appearances, all with similar excellent colour rendering. These tri-phosphors are more efficient than the earlier types and represent the best economic lighting solution, even though the lamps are more expensive. Improved efficacy reduces operating and installation costs.
The tri-phosphor principle has been extended by multi-phosphor lamps where critical colour rendering is necessary, such as for art galleries and industrial colour matching.
The modern narrow-band phosphors are more durable, have better lumen maintenance, and increase lamp life.
Compact fluorescent lamps
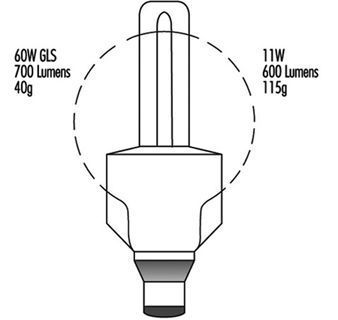
The fluorescent tube is not a practical replacement for the incandescent lamp because of its linear shape. Small, narrow-bore tubes can be configured to approximately the same size as the incandescent lamp, but this imposes a much higher electrical loading on the phosphor material. The use of tri-phosphors is essential to achieve acceptable lamp life. See figure 6.
Figure 6. Four-leg compact fluorescent
All compact fluorescent lamps use tri-phosphors, so, when they are used together with linear fluorescent lamps, the latter should also be tri-phosphor to ensure colour consistency.
Some compact lamps include the operating control gear to form retro-fit devices for incandescent lamps. The range is increasing and enables easy upgrading of existing installations to more energy-efficient lighting. These integral units are not suitable for dimming where that was part of the original controls.
High-frequency electronic control gear: If the normal supply frequency of 50 or 60 Hz is increased to 30 kHz, there is a 10% gain in efficacy of fluorescent tubes. Electronic circuits can operate individual lamps at such frequencies. The electronic circuit is designed to provide the same light output as wire-wound control gear, from reduced lamp power. This offers compatibility of lumen package with the advantage that reduced lamp loading will increase lamp life significantly. Electronic control gear is capable of operating over a range of supply voltages.
There is no common standard for electronic control gear, and lamp performance may differ from the published information issued by the lamp makers.
The use of high-frequency electronic gear removes the normal problem of flicker, to which some occupants may be sensitive.
Induction lamps
Lamps using the principle of induction have recently appeared on the market. They are low-pressure mercury lamps with tri-phosphor coating and as light producers are similar to fluorescent lamps. The energy is transferred to the lamp by high-frequency radiation, at approximately 2.5 MHz from an antenna positioned centrally within the lamp. There is no physical connection between the lamp bulb and the coil. Without electrodes or other wire connections the construction of the discharge vessel is simpler and more durable. Lamp life is mainly determined by the reliability of the electronic components and the lumen maintenance of the phosphor coating.
High-pressure mercury lamps
High-pressure discharges are more compact and have higher electrical loads; therefore, they require quartz arc tubes to withstand the pressure and temperature. The arc tube is contained in an outer glass envelope with a nitrogen or argon-nitrogen atmosphere to reduce oxidation and arcing. The bulb effectively filters the UV radiation from the arc tube. See figure 7.
Figure 7. Mercury lamp construction
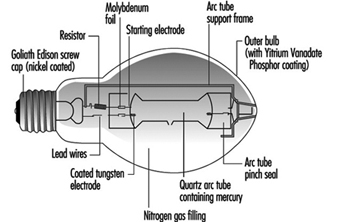
At high pressure, the mercury discharge is mainly blue and green radiation. To improve the colour a phosphor coating of the outer bulb adds red light. There are deluxe versions with an increased red content, which give higher light output and improved colour rendering.
All high-pressure discharge lamps take time to reach full output. The initial discharge is via the conducting gas fill, and the metal evaporates as the lamp temperature increases.
At the stable pressure the lamp will not immediately restart without special control gear. There is a delay while the lamp cools sufficiently and the pressure reduces, so that the normal supply voltage or ignitor circuit is adequate to re-establish the arc.
Discharge lamps have a negative resistance characteristic, and so the external control gear is necessary to control the current. There are losses due to these control gear components so the user should consider total watts when considering operating costs and electrical installation. There is an exception for high-pressure mercury lamps, and one type contains a tungsten filament which both acts as the current limiting device and adds warm colours to the blue/green discharge. This enables the direct replacement of incandescent lamps.
Although mercury lamps have a long life of about 20,000 hours, the light output will fall to about 55% of the initial output at the end of this period, and therefore the economic life can be shorter.
Metal halide lamps
The colour and light output of mercury discharge lamps can be improved by adding different metals to the mercury arc. For each lamp the dose is small, and for accurate application it is more convenient to handle the metals in powder form as halides. This breaks down as the lamp warms up and releases the metal.
A metal halide lamp can use a number of different metals, each of which give off a specific characteristic colour. These include:
- dysprosium—broad blue-green
- indium—narrow blue
- lithium—narrow red
- scandium—broad blue-green
- sodium—narrow yellow
- thallium—narrow green
- tin—broad orange-red
There is no standard mixture of metals, so metal halide lamps from different manufacturers may not be compatible in appearance or operating performance. For lamps with the lower wattage ratings, 35 to 150 W, there is closer physical and electrical compatibility with a common standard.
Metal halide lamps require control gear, but the lack of compatibility means that it is necessary to match each combination of lamp and gear to ensure correct starting and running conditions.
Low-pressure sodium lamps
The arc tube is similar in size to the fluorescent tube but is made of special ply glass with an inner sodium resistant coating. The arc tube is formed in a narrow “U” shape and is contained in an outer vacuum jacket to ensure thermal stability. During starting, the lamps have a strong red glow from the neon gas fill.
The characteristic radiation from low-pressure sodium vapour is a monochromatic yellow. This is close to the peak sensitivity of the human eye, and low-pressure sodium lamps are the most efficient lamps available at nearly 200 lumens/watt. However the applications are limited to where colour discrimination is of no visual importance, such as trunk roads and underpasses, and residential streets.
In many situations these lamps are being replaced by high-pressure sodium lamps. Their smaller size offers better optical control, particularly for roadway lighting where there is growing concern over excessive sky glow.
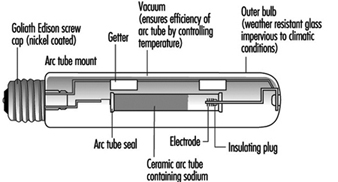
High-pressure sodium lamps
These lamps are similar to high-pressure mercury lamps but offer better efficacy (over 100 lumens/watt) and excellent lumen maintenance. The reactive nature of sodium requires the arc tube to be manufactured from translucent polycrystalline alumina, as glass or quartz are unsuitable. The outer glass bulb contains a vacuum to prevent arcing and oxidation. There is no UV radiation from the sodium discharge so phosphor coatings are of no value. Some bulbs are frosted or coated to diffuse the light source. See figure 8.
Figure 8. High-pressure sodium lamp construction
As the sodium pressure is increased, the radiation becomes a broad band around the yellow peak, and the appearance is golden white. However, as the pressure increases, the efficiency decreases. There are currently three separate types of high-pressure sodium lamps available, as shown in table 5.
Table 5. Types of high-pressure sodium lamp
|
Lamp type (code) |
Colour (K) |
Efficacy (lumens/watt) |
Life (hours) |
|
Standard |
2,000 |
110 |
24,000 |
|
Deluxe |
2,200 |
80 |
14,000 |
|
White (SON) |
2,500 |
50 |
Generally the standard lamps are used for exterior lighting, deluxe lamps for industrial interiors, and White SON for commercial/display applications.
Dimming of Discharge Lamps
The high-pressure lamps cannot be satisfactorily dimmed, as changing the lamp power changes the pressure and thus the fundamental characteristics of the lamp.
Fluorescent lamps can be dimmed using high-frequency supplies generated typically within the electronic control gear. The colour appearance remains very constant. In addition, the light output is approximately proportional to the lamp power, with consequent saving in electrical power when the light output is reduced. By integrating the light output from the lamp with the prevailing level of natural daylight, a near constant level of illuminance can be provided in an interior.
Conditions Required for Visual Comfort
Human beings possess an extraordinary capacity to adapt to their environment and to their immediate surroundings. Of all the types of energy that humans can utilize, light is the most important. Light is a key element in our capacity to see, and it is necessary to appreciate the form, the colour and the perspective of the objects that surround us in our daily lives. Most of the information we obtain through our senses we obtain through sight—close to 80%. Very often, and because we are so used to having it available, we take it for granted. We should not fail to keep in mind, however, that aspects of human welfare, like our state of mind or our level of fatigue, are affected by illumination and the colour of the things that surround us. From the point of view of safety at work, visual capacity and visual comfort are extraordinarily important. This is because many accidents are due to, among other reasons, illumination deficiencies or errors made by the worker because he or she finds it hard to identify objects or the risks associated with machinery, conveyances, dangerous containers and so on.
Visual disorders associated with deficiencies in the illumination system are common in the workplace. Due to the ability of sight to adapt to situations with deficient lighting, these aspects are sometimes not considered as seriously as they should be.
The correct design of an illumination system should offer the optimal conditions for visual comfort. For the attainment of this goal an early line of collaboration between architects, lighting designers and those responsible for hygiene at the worksite should be established. This collaboration should precede the beginning of the project, to avoid errors that would be difficult to correct once the project is completed. Among the most important aspects that should be kept in mind are the type of lamp that will be used and the lighting system that will be installed, the distribution of luminance, illumination efficiencies and the spectral composition of light.
The fact that light and colour affect the productivity and the psycho-physiological well-being of the worker should encourage the initiatives of illumination technicians, physiologists and ergonomists, to study and determine the most favourable conditions of light and colour at each work station. The combination of illumination, the contrast of luminances, the colour of light, the reproduction of colour or the selection of colours are the elements that determine colour climate and visual comfort.
Factors that Determine Visual Comfort
The prerequisites that an illumination system must fulfil in order to provide the conditions necessary for visual comfort are the following:
- uniform illumination
- optimal luminance
- no glare
- adequate contrast conditions
- correct colours
- absence of stroboscopic effect or intermittent light.
It is important to consider light in the workplace not only by quantitative criteria, but also by qualitative criteria. The first step is to study the work station, the precision required of the tasks performed, the amount of work, the mobility of the worker and so on. Light should include components both of diffuse and of direct radiation. The result of the combination will produce shadows of greater or lesser intensity that will allow the worker to perceive the form and position of objects at the work station. Annoying reflections, which make it harder to perceive details, should be eliminated, as well as excessive glare or deep shadows.
The periodic maintenance of the lighting installation is very important. The goal is to prevent the ageing of lamps and the accumulation of dust on the luminaries that will result in a constant loss of light. For this reason it is important to select lamps and systems that are easy to maintain. An incandescent light bulb maintains its efficiency until the moments before failure, but this is not the case with fluorescent tubes, which may lower their output down to 75% after a thousand hours of use.
Levels of illumination
Each activity requires a specific level of illumination in the area where the activity takes place. In general, the higher the difficulty for visual perception, the higher the average level of illumination should be as well. Guidelines for minimal levels of illumination associated with different tasks exist in various publications. Concretely, those listed in figure 1 have been gleaned from European norms CENTC 169, and are based more on experience than on scientific knowledge.
Figure 1. Levels of illumination as a function of tasks performed
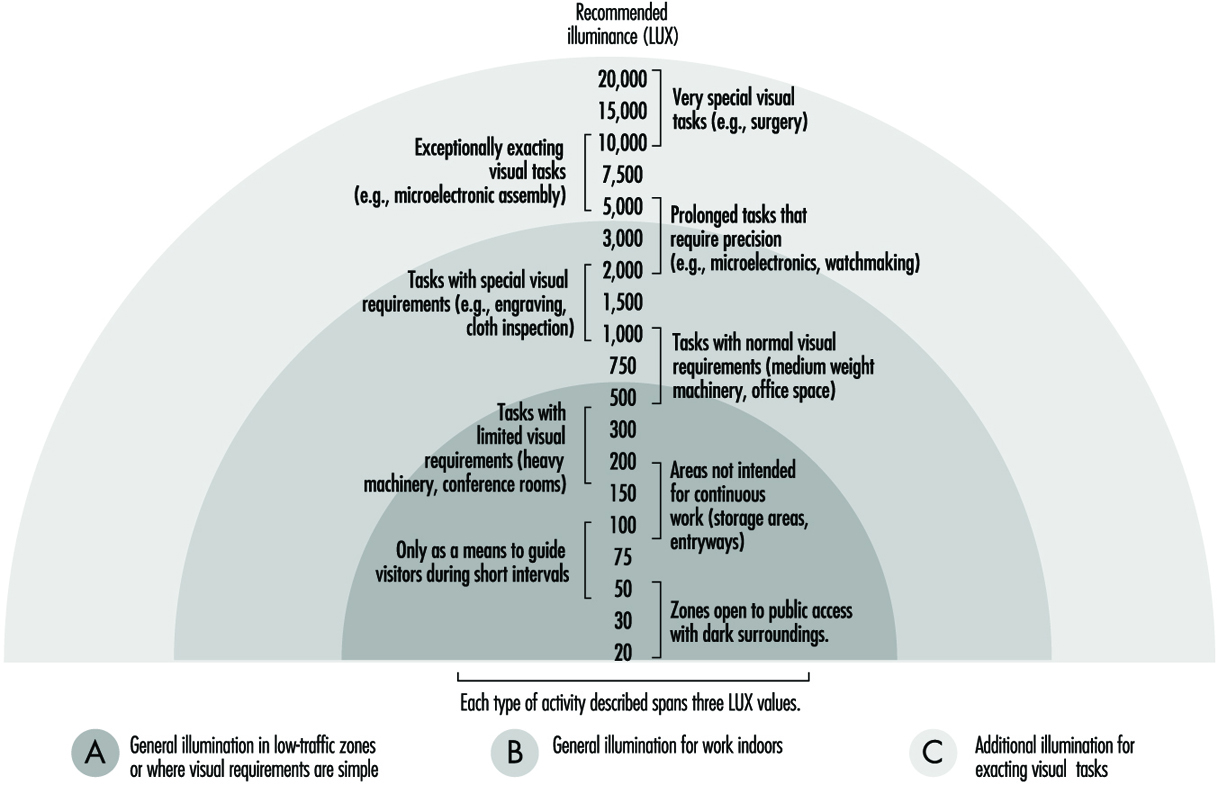
The level of illumination is measured with a luxometer that converts luminous energy into an electrical signal, which is then amplified and offers an easy reading on a calibrated scale of lux. When selecting a certain level of illumination for a particular work station the following points should be studied:
- the nature of the work
- reflectance of the object and of the immediate surroundings
- differences with natural light and the need for daytime illumination
- the worker’s age.
Units and magnitudes of illumination
Several magnitudes are commonly used in the field of illumination. The basic ones are:
Luminous flux: Luminous energy emitted per unit of time by a light source. Unit: lumen (lm).
Luminous intensity: Luminous flux emitted in a given direction by a light that is not equally distributed. Unit: candela (cd).
Level of illumination: Level of illumination of a surface of one square metre when it receives a luminous flux of one lumen. Unit: lux = lm/m2.
Luminance or photometric brilliance: Is defined for a surface in a particular direction, and is the relation between luminous intensity and the surface seen by an observer situated in the same direction (apparent surface). Unit: cd/m2.
Contrast: Difference in luminance between an object and its surroundings or between different parts of an object.
Reflectance: Proportion of light that is reflected by a surface. It is a non-dimensional quantity. Its value ranges between 0 and 1.
Factors that affect the visibility of objects
The degree of safety with which a task is executed depends, in large part, on the quality of illumination and on visual capacities. The visibility of an object can be altered in many ways. One of the most important is the contrast of luminances due to reflection factors, to shadows, or to colours of the object itself, and to the reflection factors of colour. What the eye really perceives are the differences of luminance between an object and its surroundings, or between different parts of the same object. Table 1 lists the contrasts between colours in descending order.
The luminance of an object, of its surroundings, and of the work area influence the ease with which an object is seen. It is therefore of key importance that the area where the visual task is performed, and its surroundings, be carefully analysed.
Table 1. Colour contrasts
|
Colour contrasts in descending order |
|
|
Colour of the object |
Colour of the background |
|
Black |
Yellow |
|
Green |
White |
|
Red |
White |
|
Blue |
White |
|
White |
Blue |
|
Black |
White |
|
Yellow |
Black |
|
White |
Red |
|
White |
Green |
|
White |
Black |
The size of the object that must be observed, which may be adequate or not depending on the distance and the angle of vision of the observer, is another factor. These last two factors determine the arrangement of the work station, classifying different zones according to their ease of vision. We can establish five zones in the work area (see figure 2).
Figure 2. Distribution of visual zones in the work station
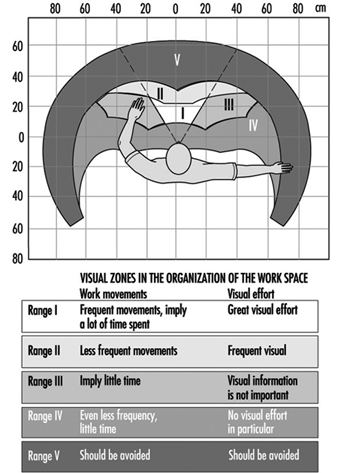
Another factor is the time frame during which vision occurs. The time of exposure will be greater or smaller depending on whether the object and the observer are static, or whether one or both of them are moving. The adaptive capacity of the eye to adjust automatically to the different illuminations of objects can also have considerable influence on visibility.
Light distribution; glare
Key factors in the conditions that affect vision are the distribution of light and the contrast of luminances. In so far as the distribution of light is concerned, it is preferable to have good general illumination instead of localized illumination in order to avoid glare. For this reason, electrical accessories should be distributed as uniformly as possible in order to avoid differences in luminous intensity. Constant shuttling through zones that are not uniformly illuminated causes eye fatigue, and with time this can lead to reduced visual output.
Glare is produced when a brilliant source of light is present in the visual field; the result is a diminution in the capacity to distinguish objects. Workers who suffer the effects of glare constantly and successively can suffer from eye strain as well as from functional disorders, even though in many cases they are not aware of it.
Glare can be direct when its origin is bright sources of light directly in the line of vision, or by reflection when light is reflected on surfaces with high reflectance. The factors involved in glare are:
- Luminance of the source of light: The maximum tolerable lumi nance by direct observation is 7,500 cd/m2. Figure 3 shows some of the approximate values of luminance for several sources of light.
- Location of the source of light: This kind of glare occurs when the source of light is within a 45-degree angle of the observer’s line of sight, and will be minimized to the degree that the source of light is placed beyond that angle. Ways and methods of avoiding direct and reflective glare can be seen in the following figures (see figure 4).
Figure 3. Approximate values of luminance
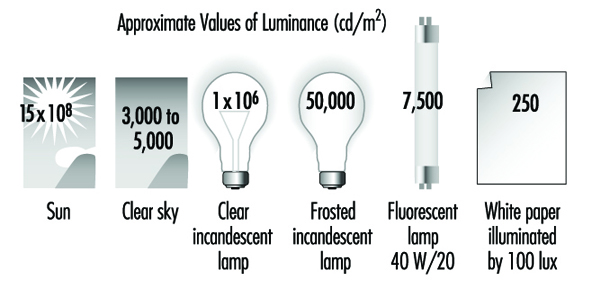
Figure 4. Factors that affect glare
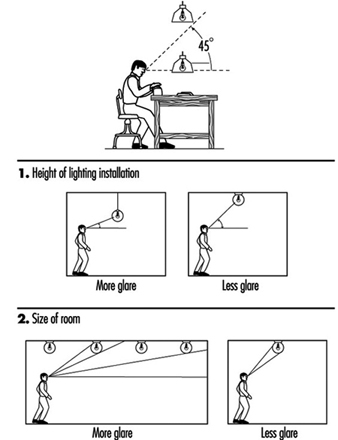
In general, there is more glare when sources of light are mounted at lower elevations or when installed in large rooms, because sources of light in large rooms or sources of light that are too low can easily fall within the angle of vision that produces glare.
3. Distribution of luminance among different objects and surfaces: The greater the differences in luminance are among the objects within the field of vision, the greater will be the glare created and the greater will be the deterioration in the capacity to see due to the effects on the adaptive processes of sight. The maximum recommended luminance disparities are:
- visual task—work surface: 3:1
- visual task—surroundings: 10:1
4. Time frame of the exposure: Even light sources with a low luminance can cause glare if the length of the exposure is prolonged too much.
Avoiding glare is a relatively simple proposition and can be achieved in different ways. One way, for example, is by placing grilles under the sources of illumination, or by using enveloping diffusers or parabolic reflectors that can direct light properly, or by installing the sources of light in such a way that they will not interfere with the angle of vision. When designing the work site, the correct distribution of luminance is as important as the illumination itself, but it is also important to consider that a distribution of luminance that is too uniform makes the three-dimensional and spatial perception of objects more difficult.
Lighting Systems
The interest in natural illumination has increased recently. This is due less to the quality of illumination it affords than to the well-being that it provides. But since the level of illumination from natural sources is not uniform, an artificial lighting system is required.
The most common lighting systems used are the following:
General uniform illumination
In this system light sources are spread out evenly without regard to the location of the work stations. The average level of illumination should be equal to the level of illumination required for the task that will be carried out. These systems are used mainly in workplaces where work stations are not fixed.
It should conform to three fundamental characteristics: The first is to be equipped with anti-glare devices (grilles, diffusers, reflectors and so on). The second is that it should distribute a fraction of the light toward the ceiling and the upper part of the walls. And the third is that the light sources should be installed as high as possible, to minimize glare and achieve illumination that is as homogeneous as possible. (See figure 5)
Figure 5. Lighting systems

This system tries to reinforce the general illumination scheme by placing lamps close to the work surfaces. These types of lamps often produce glare, and reflectors should be placed in such a way that they block the source of light from the direct sight of the worker. The use of localized illumination is recommended for those applications where visual demands are very critical, such as levels of illumination of 1,000 lux or greater. Generally, visual capacity deteriorates with the age of the worker, which makes it necessary to increase the level of general illumination or to second it with localized illumination. This phenomenon can be clearly appreciated in figure 6.
Figure 6. Loss of visual acuity with age
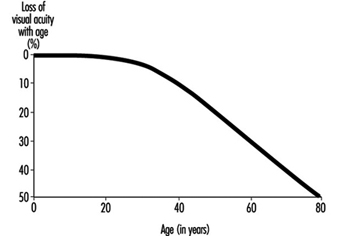
General localized illumination
This type of illumination consists of ceiling sources distributed with two things in mind—the illumination characteristics of the equipment and the illumination needs of each work station. This type of illumination is indicated for those spaces or work areas that will require a high level of illumination, and it requires knowing the future location of each work station in advance of the design stage.
Colour: Basic Concepts
Selecting an adequate colour for a worksite contributes a great deal to the efficiency, safety and general well-being of the employees. In the same way, the finish of the surfaces and of the equipment found in the work environment contributes to creating pleasant visual conditions and a pleasant work environment.
Ordinary light consists of electromagnetic radiations of different wavelengths that correspond to each of the bands of the visible spectrum. By mixing red, yellow and blue light we can obtain most of the visible colours, including white. Our perception of the colour of an object depends on the colour of the light with which it is illuminated and on the way the object itself reflects light.
Lamps can be classified into three categories depending on the appearance of the light they emit:
- colour with a warm appearance: a white, reddish light recommended for residential use
- colour with intermediate appearance: a white light recommended for worksites
- colour with a cold appearance: a white, bluish light recommended for tasks that require a high level of illumination or for hot climates.
Colours may also be classified as warm or cold according to their tonality (see figure 7).
Figure 7. Tonality of "warm" and "cold" colours

Contrast and temperature of different colours
Colour contrasts are influenced by the colour of the light selected, and for that reason the quality of illumination will depend on the colour of the light chosen for an application. The selection of the colour of light to be used should be made based on the task that will be carried out under it. If the colour is close to white, the rendition of colour and the diffusion of light will be better. The more light approaches the red end of the spectrum the worse the reproduction of colour will be, but the environment will be warmer and more inviting.
The colour appearance of illumination depends not only on the colour of light, but also on the level of luminous intensity. A colour temperature is associated with the different forms of illumination. The sensation of satisfaction with the illumination of a given environment depends on this colour temperature. In this way, for example, a 100 W incandescent filament light bulb has a colour temperature of 2,800 K, a fluorescent tube has a colour temperature of 4,000 K and an overcast sky has a colour temperature of 10,000 K.
Kruithof defined, through empirical observations, a diagram of well-being for different levels of illumination and colour temperatures in a given environment (see figure 8). In this way, he demonstrated that it is possible to feel comfortable in certain environments with low levels of illumination if the colour temperature is also low—if the level of illumination is one candle, for example, with a colour temperature of 1,750 K.
Figure 8. Comfort diagram as a function of illumination and colour temperatures

The colours of electric lamps can be subdivided into three groups related to their colour temperatures:
- daylight white—around 6,000 K
- neutral white—around 4,000 K
- warm white—around 3,000 K
Combination and selection of colours
The selection of colours is very relevant when we consider it together with those functions where identifying the objects that must be manipulated is important. It is also relevant when delimiting avenues of communication and in those tasks that require sharp contrast.
The selection of tonality is not as important a question as the selection of the proper reflective qualities of a surface. There are several recommendations that apply to this aspect of work surfaces:
Ceilings: The surface of a ceiling should be as white as possible (with a reflection factor of 75%), because light will then reflect from it in a diffuse way, dissipating darkness and reducing the glare from other surfaces. This will also mean a savings in artificial lighting.
Walls and floors: The surfaces of walls at eye level can produce glare. Pale colours with reflective factors of 50 to 75% tend to be adequate for walls. While glossy paints tend to last longer than matte colours, they are more reflective. Walls should therefore have a matte or semi-gloss finish.
Floors should be finished in slightly darker colours than walls and ceilings to avoid glare. The reflective factor of floors should be between 20 and 25%.
Equipment: Work surfaces, machinery and tables should have reflective factors of between 20 and 40%. Equipment should have a lasting finish of pure colour—light browns or greys—and the material should not be shiny.
The proper use of colours in the work environment facilitates well-being, increases productivity and can have a positive impact on quality. It can also contribute to better organization and the prevention of accidents.
There is a generalized belief that whitening the walls and ceilings and supplying adequate levels of illumination is all that can possibly be done as far as the visual comfort of employees is concerned. But these comfort factors can be improved by combining white with other colours, thus avoiding the fatigue and the boredom that characterize monochromatic environments. Colours also have an effect on a person’s level of stimulation; warm colours tend to activate and relax, while cold colours are used to induce the individual to release or liberate his or her energy.
The colour of light, its distribution, and the colours used in a given space are, among others, key factors that influence the sensations a person feels. Given the many colours and comfort factors that exist, it is impossible to set precise guidelines, especially considering that all these factors must be combined according to the characteristics and the requirements of a particular work station. A number of basic and general practical rules can be listed, however, that can help create a liveable environment:
- Bright colours produce comfortable, stimulating and serene feelings, while dark colours tend to have a depressing effect.
- Sources of warm-coloured light help reproduce warm colours well. Warm-coloured objects are more pleasing to the eye in warm light than in cold light.
- Clear and dull colours (like pastels) are very appropriate as background colours, while objects should have rich and saturated colours.
- Warm colours excite the nervous system and give the sensation that temperature is rising.
- Cold colours are preferable for objects. They have a calming effect and can be used to produce the effect of curvature. Cold colours help create the sensation that temperature is dropping.
- The sensation of colour of an object depends on the background colour and on the effect of the light source on its surface.
- Environments that are physically cold or hot can be tempered by using warm or cold lighting, respectively.
- The intensity of a colour will be inversely proportional to the part of the normal visual field that it occupies.
- The spatial appearance of a room can be influenced by colour. A room will seem to have a lower ceiling if its walls are painted a bright colour and the floor and ceiling are darker, and it will seem to have a higher ceiling if the walls are darker and the ceiling is bright.
Identifying objects through colour
The selection of colours can influence the effectiveness of lighting systems by influencing the fraction of light that is reflected. But colour also plays a key role when it comes to identifying objects. We can use brilliant and eye-catching colours or colour contrasts to highlight situations or objects that require special attention. Table 2 lists some of the factors of reflection for different colours and materials.
Table 2. Reflection factors of different colours and materials illuminated with white light
|
Colour/material |
Reflection factor (%) |
|
White |
100 |
|
White paper |
80–85 |
|
Ivory, lime-yellow |
70–75 |
|
Bright yellow, light ochre, light green, pastel blue, light pink, cream |
60–65 |
|
Lime-green, pale gray, pink, orange, blue-gray |
50–55 |
|
Blond wood, blue sky |
40–45 |
|
Oak, dry concrete |
30–35 |
|
Deep red, leaf-green, olive-green, meadow-green |
20–25 |
|
Dark blue, purple |
10–15 |
|
Black |
0 |
In any case, identification by colour should be employed only when it is truly necessary, since identification by colour will work properly only if there are not too many objects that are highlighted by colour. The following are some recommendations for identifying different elements by colour:
- Fire and safety equipment: It is advisable to identify this equipment by placing a recognizable graphic on the nearest wall so that it can be found quickly.
- Machinery: The colouring of stop or emergency devices with bright colours on all machinery is critical. It is also advisable to mark with colour the areas that need lubrication or periodic maintenance, which can add ease and functionality to these procedures.
- Tubing and pipes: If they are important or carry dangerous substances the best advice is to colour them completely. In some cases it may be enough to colour only a line along their length.
- Stairways: In order to make descent easier, one band for every step is preferable to several.
- Risks: Colour should be used to identify a risk only when the risk cannot be eliminated. Identification will be much more effective if it is carried out according to a predetermined colour code.
General Lighting Conditions
Lighting is provided within interiors in order to satisfy the following requirements:
- to assist in providing a safe working environment
- to assist in the performance of visual tasks
- to develop an appropriate visual environment.
The provision of a safe working environment has to be at the top of the list of priorities, and, in general, safety is increased by making hazards clearly visible. The order of priority of the other two requirements will depend to a large extent upon the use to which the interior is put. Task performance can be improved by ensuring that task detail is easier to see, while appropriate visual environments are developed by varying the lighting emphasis given to objects and surfaces within an interior.
Our general feeling of well-being, including morale and fatigue, is influenced by light and colour. Under low lighting levels, objects would have little or no colour or shape and there would be a loss in perspective. Conversely an excess of light may be just as unwanted as too little light.
In general, people prefer a room with daylight to a room which is windowless. Furthermore, contact with the outside world is considered to aid the feeling of well-being. The introduction of automatic lighting controls, together with high-frequency dimming of fluorescent lamps, has made it possible to provide interiors with a controlled combination of daylight and artificial light. This has the added benefit of saving on energy costs.
Perception of the character of an interior is influenced by both the brightness and colour of visible surfaces, both interior and exterior. The general lighting conditions within an interior can be achieved by using daylight or artificial lighting, or more likely by a combination of both.
Evaluation of Lighting
General requirements
Lighting systems used in commercial interiors can be sub-divided into three major categories—general lighting, localized lighting and local lighting.
General lighting installations typically provide an approximately uniform illuminance over the whole of the working plane. Such systems are often based upon the lumen method of design, where an average illuminance is:
Average illuminance (lux) =![]()
Localized lighting systems provide illuminance on general work areas with a simultaneous reduced level of illuminance in adjacent areas.
Local lighting systems provide illuminance for relatively small areas incorporating visual tasks. Such systems are normally complemented by a specified level of general lighting. Figure 1 illustrates the typical differences between the systems described.
Figure 1. Lighting systems
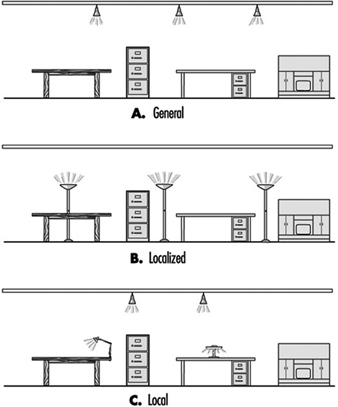
Where visual tasks are to be performed it is essential to achieve a demanded level of illuminance and to consider the circumstances that influence its quality.
The use of daylight to illuminate tasks has both merits and limitations. Windows admitting daylight into an interior provide good three-dimensional modelling, and though the spectral distribution of daylight varies throughout the day, its colour rendering is generally considered to be excellent.
However, a constant illuminance on a task cannot be provided by natural daylight only, due to its wide variability, and if the task is within the same field of view as a bright sky, then disabling glare is likely to occur, thereby impairing task performance. The use of daylight for task illuminance has only partial success, and artificial lighting, over which greater control can be exercised, has a major role to play.
Since the human eye will perceive surfaces and objects only through light which is reflected from them, it follows that surface characteristics and reflectance values together with the quantity and quality of light will influence the appearance of the environment.
When considering the lighting of an interior it is essential to determine the illuminance level and to compare it with recommended levels for different tasks (see table 1).
Table 1. Typical recommended levels of maintained illuminance for different locations or visual tasks
|
|
Typical recommended level of maintained illuminance (lux) |
|
General offices |
500 |
|
Computer workstations |
500 |
|
Factory assembly areas |
|
|
Rough work |
300 |
|
Medium work |
500 |
|
Fine work |
750 |
|
Very fine work |
|
|
Instrument assembly |
1,000 |
|
Jewellery assembly/repairs |
1,500 |
|
Hospital operating theatres |
50,000 |
Lighting for visual tasks
The ability of the eye to discern detail—visual acuity—is significantly influenced by task size, contrast and the viewer’s visual performance. Increase in the quantity and quality of lighting will also significantly improve visual performance. The effect of lighting on task performance is influenced by the size of the critical details of the task and upon the contrast between task and surrounding background. Figure 2 shows the effects of illuminance upon visual acuity. When considering visual task lighting it is important to consider the ability of the eye to carry out the visual task with both speed and accuracy. This combination is known as visual performance. Figure 3 gives typical effects of illuminance on the visual performance of a given task.
Figure 2. Typical relationship between visual acuity and illuminance
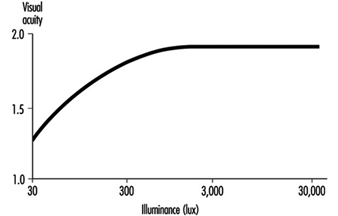
Figure 3. Typical relationship between visual performance and illuminance
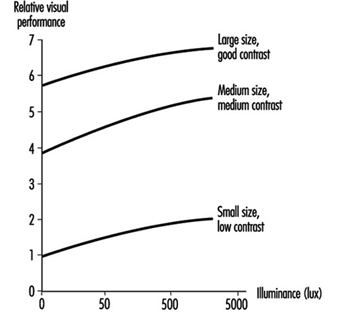
The prediction of illuminance reaching a working surface is of prime importance in lighting design. However, the human visual system responds to the distribution of luminance within the field of view. The scene within a visual field is interpreted by differentiating between surface colour, reflectance and illumination. Luminance depends upon both the illuminance on, and reflectance of, a surface. Both illuminance and luminance are objective quantities. The response to brightness, however, is subjective.
In order to produce an environment which provides visual satisfaction, comfort and performance, luminances within the field of view need to be balanced. Ideally the luminances surrounding a task should decrease gradually, thereby avoiding harsh contrasts. Suggested variation in luminance across a task is shown in figure 4.
Figure 4. Variation in luminance across a task

The lumen method of lighting design leads to an average horizontal plane illuminance on the working plane, and it is possible to use the method to establish average illuminance values on the walls and ceilings within an interior. It is possible to convert average illuminance values into average luminance values from details of the mean reflectance value of the room surfaces.
The equation relating luminance and illuminance is: ![]()
Figure 5. Typical relative illuminance values together with suggested reflectance values
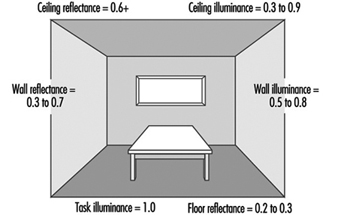
Figure 5 shows a typical office with relative illuminance values (from an overhead general lighting system) on the main room surfaces together with suggested reflectances. The human eye tends to be drawn to that part of the visual scene which is brightest. It follows that higher luminance values usually occur at a visual task area. The eye acknowledges detail within a visual task by discriminating between lighter and darker parts of the task. The variation in brightness of a visual task is determined from calculation of the luminance contrast:
![]()
where
Lt = Luminance of the task
Lb = Luminance of the background
and both luminances are measured in cd·m–2
The vertical lines in this equation signify that all values of luminance contrast are to be considered positive.
The contrast of a visual task will be influenced by the reflectance properties of the task itself. See figure 5.
Optical Control of Lighting
If a bare lamp is used in a luminaire, the distribution of light is unlikely to be acceptable and the system will almost certainly be uneconomical. In such situations the bare lamp is likely to be a source of glare to the room occupants, and while some light may eventually reach the working plane, the effectiveness of the installation is likely to be seriously reduced because of the glare.
It will be evident that some form of light control is required, and the methods most frequently employed are detailed below.
Obstruction
If a lamp is installed within an opaque enclosure with only a single aperture for the light to escape, then the light distribution will be very limited, as shown in figure 6.
Figure 6. Lighting output control by obstruction
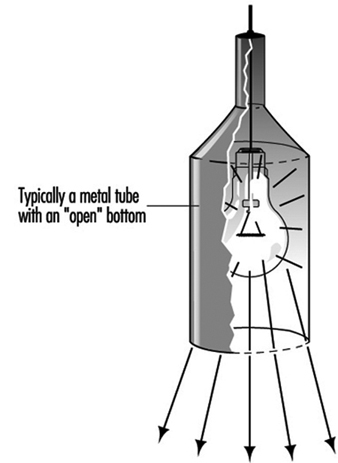
Reflection
This method uses reflective surfaces, which may vary from a highly matt finish to a highly specular or mirror-like finish. This method of control is more efficient than obstruction, since stray light is collected and redirected to where it is required. The principle involved is shown in figure 7.
Figure 7. Light output control by reflection

Diffusion
If a lamp is installed within a translucent material, the apparent size of the light source is increased with a simultaneous reduction in its brightness. Practical diffusers unfortunately absorb some of the emitted light, which consequently reduces the overall efficiency of the luminaire. Figure 8 illustrates the principle of diffusion.
Figure 8. Light output control by diffusion

Refraction
This method uses the “prism” effect, where typically a prism material of glass or plastic “bends” the rays of light and in so doing redirects the light to where it is required. This method is extremely suitable for general interior lighting. It has the advantage of combining good glare control with an acceptable efficiency. Figure 9 shows how refraction assists in optical control.
In many cases a luminaire will use a combination of the methods of optical control described.
Figure 9. Light output control by refraction

Luminance distribution
The light output distribution from a luminaire is significant in determining the visual conditions subsequently experienced. Each of the four methods of optical control described will produce differing light output distribution properties from the luminaire.
Veiling reflections often occur in areas where VDUs are installed. The usual symptoms experienced in such situations are reduced ability to read correctly from the text on a screen due to the appearance of unwanted high-luminance images on the screen itself, typically from overhead luminaires. A situation can develop where veiling reflections also appear on paper on a desk in an interior.
If the luminaires in an interior have a strong vertically downward component of light output, then any paper on a desk beneath such a luminaire will reflect the light source into the eyes of an observer who is reading from or working on the paper. If the paper has a gloss finish, the situation is aggravated.
The solution to the problem is to arrange for the luminaires used to have a light output distribution which is predominantly at an angle to the downward vertical, so that following the basic laws of physics (angle of incidence = angle of reflection) the reflected glare will be minimized. Figure 10 shows a typical example of both the problem and the cure. The light output distribution from the luminaire used to overcome the problem is referred to as a batwing distribution.
Figure 10. Veiling reflections
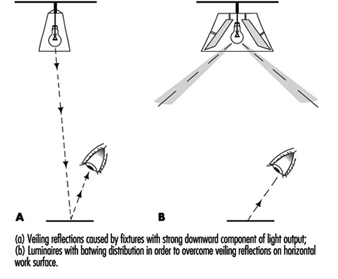
Light distribution from luminaires can also lead to direct glare, and in an attempt to overcome this problem, local lighting units should be installed outside the 45-degree “forbidden angle”, as shown in figure 11.
Figure 11. Diagrammatic representation of the forbidden angle
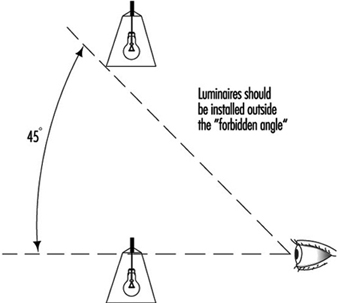
Optimal Lighting Conditions for Visual Comfortand Performance
It is appropriate when investigating lighting conditions for visual comfort and performance to consider those factors affecting the ability to see detail. These can be sub-divided into two categories—characteristics of the observer and characteristics of the task.
Characteristics of the observer.
These include:
- sensitivity of the individual’s visual system to size, contrast, exposure time
- transient adaptation characteristics
- susceptibility to glare
- age
- motivational and psychological characteristics.
Characteristics of the task.
These include:
- configuration of detail
- contrast of detail/background
- background luminance
- specularity of detail.
With reference to particular tasks, the following questions need to be answered:
- Are the task details easy to see?
- Is the task likely to be undertaken for lengthy periods?
- If errors result from the performance of the task, are the consequences considered to be serious?
In order to produce optimal workplace lighting conditions it is important to consider the requirements placed upon the lighting installation. Ideally task lighting should reveal colour, size, relief and surface qualities of a task while simultaneously avoiding the creation of potentially dangerous shadows, glare and “harsh” surroundings to the task itself.
Glare.
Glare occurs when there is excessive luminance in the field of view. The effects of glare on vision can be divided into two groups, termed disability glare and discomfort glare.
Consider the example of glare from the headlights of an oncoming vehicle during darkness. The eye cannot adapt simultaneously to the headlights of the vehicle and to the much lower brightness of the road. This is an example of disability glare, since the high luminance light sources produce a disabling effect due to the scattering of light in the optic media. Disability glare is proportional to the intensity of the offending source of light.
Discomfort glare, which is more likely to occur in interiors, can be reduced or even totally eliminated by reducing the contrast between the task and its surroundings. Matt, diffusely reflecting finishes on work surfaces are to be preferred to gloss or specularly reflecting finishes, and the position of any offending light source should be outside the normal field of vision. In general, successful visual performance occurs when the task itself is brighter than its immediate surrounds, but not excessively.
The magnitude of discomfort glare is given a numerical value and compared with reference values in order to predict whether the level of discomfort glare will be acceptable. The method of calculation of glare index values used in the UK and elsewhere is considered under “Measurement”.
Measurement
Lighting surveys
One survey technique often used relies upon a grid of measuring points over the whole area under consideration. The basis of this technique is to divide the whole of the interior into a number of equal areas, each ideally square. The illuminance at the centre of each of the areas is measured at desk-top height (typically 0.85 metres above floor level), and an average value of illuminance is calculated. The accuracy of the value of average illuminance is influenced by the number of measuring points used.
A relationship exists which enables the minimum number of measuring points to be calculated from the value of room index applicable to the interior under consideration.
![]()
Here, length and width refer to the room dimensions, and mounting height is the vertical distance between the centre of the light source and the working plane.
The relationship referred to is given as:
Minimum number of measuring points = (x + 2)2
where “x” is the value of the room index taken to the next highest whole number, except that for all values of RI equal to or greater than 3, x is taken as 4. This equation gives the minimum number of measuring points, but conditions often require more than this minimum number of points to be used.
When considering the lighting of a task area and its immediate surround, variance in illuminance or uniformity of illuminance must be considered.
![]()
Over any task area and its immediate surround, uniformity should be not less than 0.8.
In many workplaces it is unnecessary to illuminate all areas to the same level. Localized or local lighting may provide some degree of energy saving, but whichever system is used the variance in illuminance across an interior must not be excessive.
The diversity of illuminance is expressed as:
![]()
At any point in the major area of the interior, the diversity of illuminance should not exceed 5:1.
Instruments used for measuring illuminance and luminance typically have spectral responses which vary from the response of the human visual system. The responses are corrected, often by the use of filters. When filters are incorporated, the instruments are referred to as colour corrected.
Illuminance meters have a further correction applied which compensates for the direction of incident light falling upon the detector cell. Instruments which are capable of accurately measuring illuminance from varying directions of incident light are said to be cosine corrected.
Measurement of glare index
The system used frequently in the UK, with variations elsewhere, is essentially a two-stage process. The first stage establishes an uncorrected glare index value (UGI). Figure 12 provides an example.
Figure 12. Elevation and plan views of typical interior used in example
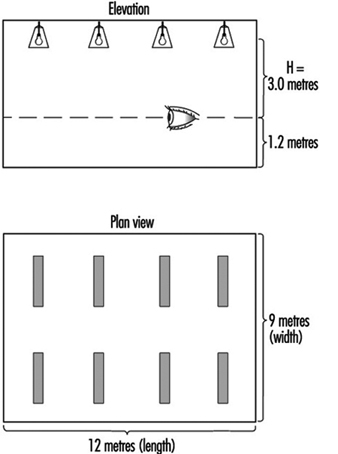
The height H is the vertical distance between the centre of the light source and the eye level of a seated observer, which is normally taken as 1.2 metres above floor level. The major dimensions of the room are then converted into multiples of H. Thus, since H = 3.0 metres, then length = 4H and width = 3H. Four separate calculations of UGI have to be made in order to determine the worst case scenario in accordance with the layouts shown in figure 13.
Figure 13. Possible combinations of luminaire orientation and viewing direction within the interior considered in the example
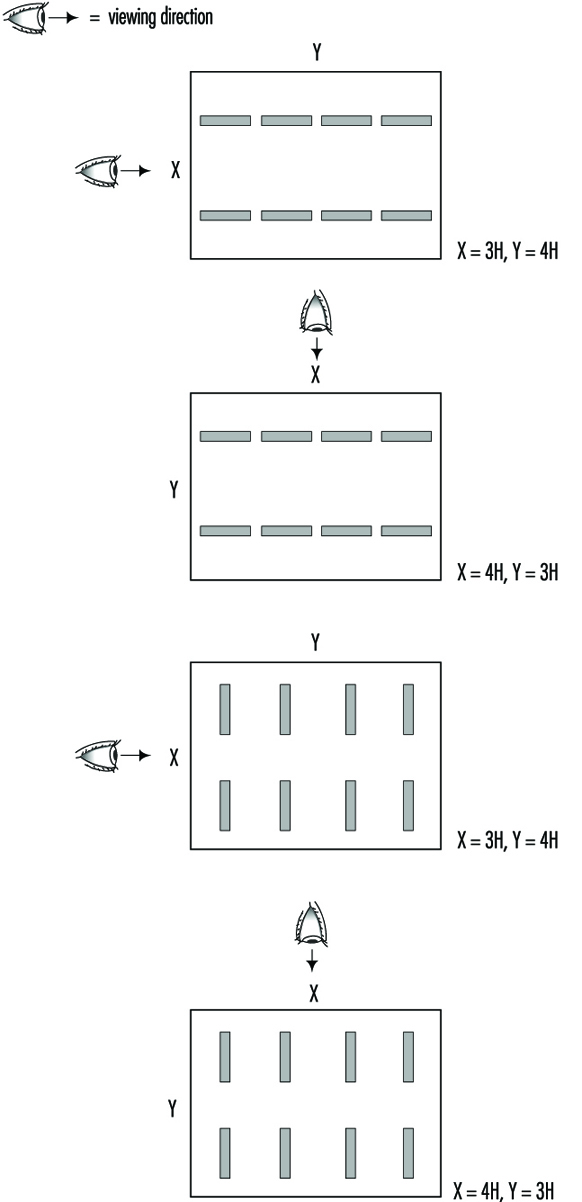
Tables are produced by lighting equipment manufacturers which specify, for given values of fabric reflectance within a room, values of uncorrected glare index for each combination of values of X and Y.
The second stage of the process is to apply correction factors to the UGI values depending upon values of lamp output flux and deviation in value of height (H).
The final glare index value is then compared with the Limiting Glare Index value for specific interiors, given in references such as the CIBSE Code for Interior Lighting (1994).
The Nature and Effects of Noise
The Pervasive Nature of Occupational Noise
Noise is one of the most common of all the occupational hazards. In the United States, for example, more than 9 million workers are exposed to daily average A-weighted noise levels of 85 decibels (abbreviated here as 85 dBA). These noise levels are potentially hazardous to their hearing and can produce other adverse effects as well. There are approximately 5.2 million workers exposed to noise above these levels in manufacturing and utilities, which represents about 35% of the total number of workers in US manufacturing industries.
Hazardous noise levels are easily identified and it is technologically feasible to control excessive noise in the vast majority of cases by applying off-the-shelf technology, by redesigning the equipment or process or by retrofitting noisy machines. But all too often, nothing is done. There are several reasons for this. First, although many noise control solutions are remarkably inexpensive, others can be costly, especially when the aim is to reduce the noise hazard to levels of 85 or 80 dBA.
One very important reason for the absence of noise control and hearing conservation programmes is that, unfortunately, noise is often accepted as a “necessary evil”, a part of doing business, an inevitable part of an industrial job. Hazardous noise causes no bloodshed, breaks no bones, produces no strange-looking tissue, and, if workers can manage to get through the first few days or weeks of exposure, they often feel as though they have “got used” to the noise. But what has most likely happened is that they have started to incur a temporary hearing loss which dulls their hearing sensitivity during the work day and often subsides during the night. Thus, the progress of noise-induced hearing loss is insidious in that it creeps up gradually over the months and years, largely unnoticed until it reaches handicapping proportions.
Another important reason why the hazards of noise are not always recognized is that there is a stigma attached to the resulting hearing impairment. As Raymond Hétu has demonstrated so clearly in his article on rehabilitation from noise-induced hearing loss elsewhere in this Encyclopaedia, people with hearing impairments are often thought of as elderly, mentally slow and generally incompetent, and those at risk of incurring impairments are reluctant to acknowledge either their impairments or the risk for fear of being stigmatized. This is an unfortunate situation because noise-induced hearing losses become permanent, and, when added to the hearing loss that naturally occurs with ageing, can lead to depression and isolation in one’s middle and old age. The time to take preventive steps is before the hearing losses begin.
The Scope of Noise Exposure
As mentioned above, noise is especially prevalent in the manufacturing industries. The US Department of Labor has estimated that 19.3% of the workers in manufacturing and utilities are exposed to daily average noise levels of 90 dBA and above, 34.4% are exposed to levels above 85 dBA, and 53.1% to levels above 80 dBA. These estimates should be fairly typical of the percentage of workers exposed to hazardous levels of noise in other nations. The levels are likely to be somewhat higher in less developed nations, where engineering controls are not used as widely, and somewhat lower in nations with stronger noise control programmes, such as the Scandinavian countries and Germany.
Many workers throughout the world experience some very hazardous exposures, well above 85 or 90 dBA. For example, the US Labor Department has estimated that nearly half a million workers are exposed to daily average noise levels of 100 dBA and above, and more than 800,000 to levels between 95 and 100 dBA in the manufacturing industries alone.
Figure 1 ranks the noisiest manufacturing industries in the United States in descending order according to the percentage of workers exposed above 90 dBA and gives estimates of noise-exposed workers by industrial sector.
Figure 1. Occupational noise exposure—the US experience

Research Needs
In the following articles of this chapter, it should become clear to the reader that the effects on hearing of most types of noise are well-known. Criteria for the effects of continuous, varying and intermittent noise were developed some 30 years ago and remain essentially the same today. This is not true, however, of impulse noise. At relatively low levels, impulse noise seems to be no more damaging and possibly less so than continuous noise, given equal sound energy. But at high sound levels, impulse noise appears to be more damaging, especially when a critical level (or, more correctly, a critical exposure) is exceeded. Further research needs to be performed to define more exactly the shape of the damage/risk curve.
Another area that needs to be clarified is the adverse effect of noise, both on hearing and on general health, in combination with other agents. Although the combined effects of noise and ototoxic drugs are fairly well known, the combination of noise and industrial chemicals is of growing concern. Solvents and certain other agents appear to be increasingly neurotoxic when experienced in conjunction with high levels of noise.
Around the world, noise-exposed workers in the manufacturing industries and the military receive the major share of attention. There are, however, many workers in mining, construction, agriculture and transportation who are also exposed to hazardous levels of noise, as pointed out in figure 1. The unique needs associated with these occupations need to be assessed, and noise control and other aspects of hearing conservation programmes need to be extended to these workers. Unfortunately, the provision of hearing conservation programmes to noise-exposed workers does not guarantee that hearing loss and the other adverse effects of noise will be prevented. Standard methods to evaluate the effectiveness of hearing conservation programmes do exist, but they can be cumbersome and are not widely used. Simple evaluation methods need to be developed that can be used by small as well as large companies, and those with minimal resources.
The technology exists to abate most noise problems, as mentioned above, but there is a large gap between the existing technology and its application. Methods need to be developed by which information on all kinds of noise control solutions can be disseminated to those who need it. Noise control information needs to be computerized and made available not only to users in developing nations but to industrialized nations as well.
Future Trends
In some countries there is a growing trend to place more emphasis on non-occupational noise exposure and its contribution to the burden of noise-induced hearing loss. These kinds of sources and activities include hunting, target shooting, noisy toys and loud music. This focus is beneficial in that it highlights some potentially significant sources of hearing impairment, but it can actually be detrimental if it diverts attention from serious occupational noise problems.
A very dramatic trend is evident among the nations belonging to the European Union, where standardization for noise is progressing at an almost breathless pace. This process includes standards for product noise emissions as well as for noise exposure standards.
The standard-setting process is not moving rapidly at all in North America, especially in the United States, where regulatory efforts are at a standstill and movement toward deregulation is a possibility. Efforts to regulate the noise of new products were abandoned in 1982 when the Noise Office in the US Environmental Protection Agency was closed, and occupational noise standards may not survive the deregulatory climate in the current US Congress.
The developing nations appear to be in the process of adopting and revising noise standards. These standards are tending toward conservatism, in that they are moving toward a permissible exposure limit of 85 dBA, and toward an exchange rate (time/intensity trading relation) of 3 dB. How well these standards are enforced, especially in burgeoning economies, is an open question.
The trend in some of the developing nations is to concentrate on controlling noise by engineering methods rather than to struggle with the intricacies of audiometric testing, hearing protection devices, training and record keeping. This would appear to be a very sensible approach wherever feasible. Supplementation with hearing protectors may be necessary at times to reduce exposures to safe levels.
The Effects of Noise
Certain of the materials which follow have been adapted from Suter, AH, “Noise and the conservation of hearing”, Chapter 2 in Hearing Conservation Manual (3rd ed.), Council for Accreditation in Occupational Hearing Conservation, Milwaukee, WI, USA (1993).
Loss of hearing is certainly the most well-known adverse effect of noise, and probably the most serious, but it is not the only one. Other detrimental effects include tinnitus (ringing in the ears), interference with speech communication and with the perception of warning signals, disruption of job performance, annoyance and extra-auditory effects. Under most circumstances, protecting workers’ hearing should protect against most other effects. This consideration provides additional support for companies to implement good noise control and hearing conservation programmes.
Hearing impairment
Noise-induced hearing impairment is very common, but it is often underrated because there are no visible effects and, in most cases, no pain. There is only a gradual, progressive loss of communication with family and friends, and a loss of sensitivity to sounds in the environment, such as birdsong and music. Unfortunately, good hearing is usually taken for granted until it is lost.
These losses may be so gradual that individuals do not realize what has happened until the impairment becomes handicapping. The first sign is usually that other people do not seem to speak as clearly as they used to. The hearing-impaired person will have to ask others to repeat themselves, and he or she often becomes annoyed with their apparent lack of consideration. Family and friends will often be told, “Don’t shout at me. I can hear you, but I just can’t understand what you’re saying.”
As the hearing loss becomes worse, the individual will begin to withdraw from social situations. Church, civic meetings, social occasions and theatre begin to lose their attraction and the individual will choose to stay at home. The volume of the television becomes a source of contention within the family, and other family members are sometimes driven out of the room because the hearing-impaired person wants it so loud.
Presbycusis, the hearing loss that naturally accompanies the ageing process, adds to the hearing handicap when the person with noise-induced hearing loss becomes older. Eventually, the loss may progress to such a severe stage that the individual can no longer communicate with family or friends without great difficulty, and then he or she is indeed isolated. A hearing aid may help in some cases, but the clarity of natural hearing will never be restored, as the clarity of vision is with eyeglasses.
Occupational hearing impairment
Noise-induced hearing impairment is usually considered an occupational disease or illness, rather than an injury, because its progression is gradual. On rare occasions, an employee may sustain immediate, permanent hearing loss from a very loud event such as an explosion or a very noisy process, such as riveting on steel. In these circumstances the hearing loss is sometimes referred to as an injury and is called “acoustic trauma”. The usual circumstance, however, is a slow decrease in hearing ability over many years. The amount of impairment will depend on the level of the noise, the duration of the exposure and the susceptibility of the individual worker. Unfortunately, there is no medical treatment for occupational hearing impairment; there is only prevention.
The auditory effects of noise are well documented and there is little controversy over the amount of continuous noise that causes varying degrees of hearing loss (ISO 1990). That intermittent noise causes hearing loss is also uncontested. But periods of noise that are interrupted by periods of quiet can offer the inner ear an opportunity to recover from temporary hearing loss and may therefore be somewhat less hazardous than continuous noise. This is true mainly for outdoor occupations, but not for inside settings such as factories, where the necessary intervals of quiet are rare (Suter 1993).
Impulse noise, such as the noise from gunfire and metal stamping, also damages hearing. There is some evidence that the hazard from impulse noise is more severe than that from other types of noise (Dunn et al. 1991; Thiery and Meyer-Bisch 1988), but this is not always the case. The amount of damage will depend mainly on the level and duration of the impulse, and it may be worse when there is continuous noise in the background. There is also evidence that high-frequency sources of impulse noise are more damaging than those composed of lower frequencies (Hamernik, Ahroon and Hsueh 1991; Price 1983).
Hearing loss due to noise is often temporary at first. During the course of a noisy day, the ear becomes fatigued and the worker will experience a reduction in hearing known as temporary threshold shift (TTS). Between the end of one workshift and the beginning of the next the ear usually recovers from much of the TTS, but often, some of the loss remains. After days, months and years of exposure, the TTS leads to permanent effects and new amounts of TTS begin to build onto the now permanent losses. A good audiometric testing programme will attempt to identify these temporary hearing losses and provide for preventive measures before the losses become permanent.
Experimental evidence indicates that several industrial agents are toxic to the nervous system and produce hearing loss in laboratory animals, especially when they occur in combination with noise (Fechter 1989). These agents include (1) heavy metal hazards, such as lead compounds and trimethyltin, (2) organic solvents, such as toluene, xylene and carbon disulphide, and (3) an asphyxiant, carbon monoxide. Recent research on industrial workers (Morata 1989; Morata et al. 1991) suggests that certain of these substances (carbon disulphide and toluene) can increase the damaging potential of noise. There is also evidence that certain drugs which are already toxic to the ear can increase the damaging effects of noise (Boettcher et al. 1987). Examples include certain antibiotics and cancer chemotherapy drugs. Those in charge of hearing conservation programmes should be aware that workers exposed to these chemicals or using these drugs may be more susceptible to hearing loss, especially when exposed to noise in addition.
Non-occupational hearing impairment
It is important to understand that occupational noise is not the only cause of noise-induced hearing loss among workers, but hearing loss can also be caused by sources outside the workplace. These sources of noise produce what is sometimes called “sociocusis”, and their effects on hearing are impossible to differentiate from occupational hearing loss. They can only be surmised by asking detailed questions about the worker’s recreational and other noisy activities. Examples of sociocusic sources could be woodworking tools, chain saws, unmuffled motorcycles, loud music and firearms. Frequent shooting with large-calibre guns (without hearing protection) may be a significant contributor to noise-induced hearing loss, whereas occasional hunting with smaller-calibre weapons is more likely to be harmless.
The importance of non-occupational noise exposure and the resulting sociocusis is that this hearing loss adds to the exposure that an individual might receive from occupational sources. For the sake of workers’ overall hearing health, they should be counselled to wear adequate hearing protection when they engage in noisy recreational activities.
Tinnitus
Tinnitus is a condition that frequently accompanies both temporary and permanent hearing loss from noise, as well as other types of sensorineural hearing loss. Often referred to as a “ringing in the ears”, tinnitus may range from mild in some cases to severe in others. Sometimes individuals report that they are more bothered by their tinnitus than they are by their hearing impairment.
People with tinnitus are likely to notice it the most in quiet conditions, such as when they are trying to go to sleep at night, or when they are sitting in a sound-proof booth taking an audiometric test. It is a sign that the sensory cells in the inner ear have been irritated. It is often a precursor to noise-induced hearing loss and therefore an important warning signal.
Communication interference and safety
The fact that noise can interfere with or “mask” speech communication and warning signals is only common sense. Many industrial processes can be carried out very well with a minimum of communication among workers. Other jobs, however, such as those performed by airline pilots, railroad engineers, tank commanders and many others rely heavily on speech communication. Some of these workers use electronic systems that suppress the noise and amplify the speech. Nowadays, sophisticated communication systems are available, some with devices that cancel unwanted acoustic signals so that communication can take place more easily.
In many cases, workers just have to make do, straining to understand communications above the noise and shouting above it or signalling. Sometimes people may develop hoarseness or even vocal nodules or other abnormalities on the vocal cords from excessive strain. These individuals may need to be referred to for medical care.
People have learned from experience that in noise levels above about 80 dBA they have to speak very loudly, and in levels above 85 dBA they have to shout. In levels much above 95 dBA they have to move close together to communicate at all. Acoustical specialists have developed methods to predict the amount of communication that can take place in industrial situations. The resulting predictions are dependent upon the acoustical characteristics of both the noise and the speech (or other desired signal), as well as the distance between talker and listener.
It is generally known that noise can interfere with safety, but only a few studies have documented this problem (e.g., Moll van Charante and Mulder 1990; Wilkins and Acton 1982). There have been numerous reports, however, of workers who have got clothing or hands caught in machines and have been seriously injured while their co-workers were oblivious to their cries for help. To prevent communication breakdowns in noisy environments, some employers have installed visual warning devices.
Another problem, recognized more by noise-exposed workers themselves than by professionals in hearing conservation and occupational health, is that hearing protection devices may sometimes interfere with the perception of speech and warning signals. This appears to be true mainly when the wearers already have hearing losses and the noise levels fall below 90 dBA (Suter 1992). In these cases, workers have a very legitimate concern about wearing hearing protection. It is important to be attentive to their concerns and either to implement engineering noise controls or to improve the kind of protection offered, such as protectors built into an electronic communication system. In addition, hearing protectors are now available with a flatter, more “high fidelity” frequency response, which may improve workers’ abilities to understand speech and warning signals.
Effects on job performance
The effects of noise on job performance have been studied both in the laboratory and in actual working conditions. The results have shown that noise usually has little effect on the performance of repetitive, monotonous work, and in some cases can actually increase job performance when the noise is low or moderate in level. High levels of noise can degrade job performance, especially when the task is complicated or involves doing more than one thing at a time. Intermittent noise tends to be more disruptive than continuous noise, particularly when the periods of noise are unpredictable and uncontrollable. Some research indicates that people are less likely to help each other and more likely to exhibit antisocial behaviour in noisy environments than in quiet ones. (For a detailed review of the effects of noise on job performance see Suter 1992).
Annoyance
Although the term “annoyance” is more often connected with community noise problems, such as airports or race-car tracks, industrial workers may also feel annoyed or irritated by the noise of their workplace. This annoyance may be related to the interference of speech communication and job performance described above, but it may also be due to the fact that many people have an aversion to noise. Sometimes the aversion to noise is so strong that a worker will look for employment elsewhere, but that opportunity is not often feasible. After a period of adjustment, most will not appear to be bothered as much, but they may still complain about fatigue, irritability and sleeplessness. (The adjustment will be more successful if young workers are properly fitted with hearing protectors from the start, before they develop any hearing loss.) Interestingly, this kind of information sometimes surfaces after a company starts a noise control and hearing conservation programme because the workers would have become aware of the contrast between earlier and subsequently improved conditions.
Extra-auditory effects
As a biological stressor, noise can influence the entire physiological system. Noise acts in the same way that other stressors do, causing the body to respond in ways that may be harmful in the long run and lead to disorders known as the “stress diseases”. When facing danger in primitive times, the body would go through a series of biological changes, preparing either to fight or to run away (the classic “fight or flight” response). There is evidence that these changes still persist with exposure to loud noise, even though a person may feel “adjusted” to the noise.
Most of these effects appear to be transitory, but with continued exposure some adverse effects have been shown to be chronic in laboratory animals. Several studies of industrial workers also point in this direction, while some studies show no significant effects (Rehm 1983; van Dijk 1990). The evidence is probably strongest for cardiovascular effects such as increased blood pressure, or changes in blood chemistry. A significant set of laboratory studies on animals showed chronic elevated blood pressure levels resulting from exposure to noise around 85 to 90 dBA, which did not return to baseline after cessation of the exposure (Peterson et al. 1978, 1981 and 1983).
Studies of blood chemistry show increased levels of the catecholamines epinephrine and norepinephrine due to noise exposure (Rehm 1983), and a series of experiments by German investigators found a connection between noise exposure and magnesium metabolism in humans and animals (Ising and Kruppa 1993). Current thinking holds that the extra-auditory effects of noise are most likely mediated psychologically, through aversion to noise, making it very difficult to obtain dose-response relationships. (For a comprehensive overview of this problem, see Ising and Kruppa 1993.)
Because the extra-auditory effects of noise are mediated by the auditory system, meaning that it is necessary to hear the noise for adverse effects to occur, properly fitted hearing protection should reduce the likelihood of these effects in just the way it does with hearing loss.
Noise Measurement and Exposure Evaluation
For the prevention of adverse effects of noise on workers, attention should be paid to the choice of appropriate instrumentation, measuring methods and procedures for evaluating workers’ exposures. It is important to evaluate correctly the different types of noise exposures, such as continuous, intermittent and impulse noise, to distinguish noise environments with differing frequency spectra, as well as to consider the variety of working situations, such as drop-forge hammering shops, rooms housing air compressors, ultrasonic welding processes, and so forth. The main purposes of noise measurement in occupational settings are to (1) identify overexposed workers and quantify their exposures and (2) assess the need both for engineering noise control and the other types of control that are indicated. Other uses of noise measurement are to evaluate the effectiveness of particular noise controls and to determine the background levels in audiometric rooms.
Measuring Instruments
Instruments for noise measurement include sound level meters, noise dosimeters and auxiliary equipment. The basic instrument is the sound level meter, an electronic instrument consisting of a microphone, an amplifier, various filters, a squaring device, an exponential averager and a read-out calibrated in decibels (dB). Sound level meters are categorized by their precision, ranging from the most precise (type 0) to the least (type 3). Type 0 is usually used in the laboratory, type 1 is used for other precision sound level measurements, type 2 is the general purpose meter, and type 3, the survey meter, is not recommended for industrial use. Figure 1 and figure 2, illustrate a sound level meter.
Figure 1. Sound level meter—calibration check. Courtesy of Larson Davis
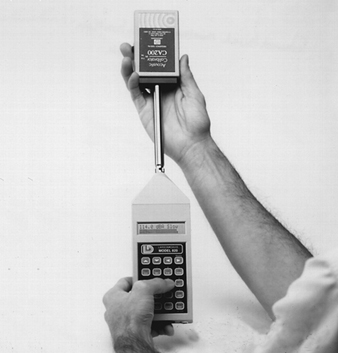
Figure 2. Sound level meter with wind screen. Courtesy of Larson Davis
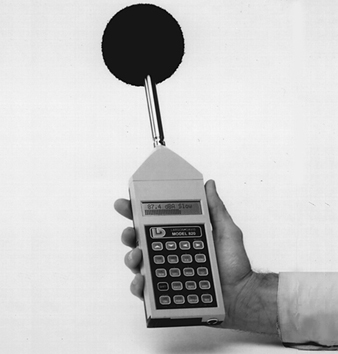
Specifications for sound level meters may be found in national and international standards, such as the International Organization for Standardization (ISO), the International Electrotechnical Commission (IEC) and the American National Standards Institute (ANSI). The IEC publications IEC 651 (1979) and IEC 804 (1985) pertain to sound level meters of types 0, 1, and 2, with frequency weightings A, B, and C, and “slow,” “fast” and “impulse” time constants. ANSI S1.4-1983, as amended by ANSI S1.4A-1985, also provides specifications for sound level meters.
To facilitate more detailed acoustical analysis, full octave-band and 1/3 octave-band filter sets may be attached to or included in modern sound level meters. Nowadays, sound level meters are becoming increasingly small and easy to use, while at the same time their measurement possibilities are expanding.
For measuring non-steady noise exposures, such as those that occur in intermittent or impulse noise environments, an integrating sound level meter is most convenient to use. These meters can simultaneously measure the equivalent, peak and maximum sound levels, and calculate, log and store several values automatically. The noise dose meter or “dosimeter” is a form of integrating sound level meter that can be worn in the shirt pocket or attached to the worker’s clothing. Data from the noise dosimeter may be computerized and printed out.
It is important to make sure that noise measuring instruments are always properly calibrated. This means checking the instrument’s calibration acoustically before and after each day’s use, as well as making electronic assessments at appropriate intervals.
Measurement Methods
The noise measurement methods to be used depend on the measurement objectives, namely, to assess the following:
- the risk of hearing impairment
- the need for and appropriate types of engineering controls
- the “noise load” for compatibility with the type of job to be performed
- the background level necessary for communication and safety.
International standard ISO 2204 gives three types of method for noise measurement: (1) the survey method, (2) the engineering method and (3) the precision method.
The survey method
This method requires the least amount of time and equipment. Noise levels of a working zone are measured with a sound level meter using a limited number of measuring points. Although there is no detailed analysis of the acoustic environment, time factors should be noted, such as whether the noise is constant or intermittent and how long the workers are exposed. The A-weighting network is usually used in the survey method, but when there is a predominant low-frequency component, the C-weighting network or the linear response may be appropriate.
The engineering method
With this method, A-weighted sound level measurements or those using other weighting networks are supplemented with measurements using full octave or 1/3 octave-band filters. The number of measuring points and the frequency ranges are selected according to the measurement objectives. Temporal factors should again be recorded. This method is useful for assessing interference with speech communication by calculating speech interference levels (SILs), as well as for engineering noise abatement programmes and for estimating the auditory and non-auditory effects of noise.
The precision method
This method is required for complex situations, where the most thorough description of the noise problem is needed. Overall measurements of sound level are supplemented with full octave or 1/3 octave-band measurements and time histories are recorded for appropriate time intervals according to the duration and fluctuations of the noise. For example, it may be necessary to measure peak sound levels of impulses using an instrument’s “peak hold” setting, or to measure levels of infrasound or ultrasound, requiring special frequency measuring capabilities, microphone directivity, and so forth.
Those who use the precision method should make sure that the instrument’s dynamic range is sufficiently great to prevent “overshoot” when measuring impulses and that the frequency response should be broad enough if infrasound or ultrasound is to be measured. The instrument should be capable of making measurements of frequencies as low as 2 Hz for infrasound and up to at least 16 kHz for ultrasound, with microphones that are sufficiently small.
The following “common sense” steps may be useful for the novice noise measurer:
- Listen for the main characteristics of the noise to be measured (temporal qualities, such as steady-state, intermittent or impulse qualities; frequency characteristics, such as those of wide-band noise, predominant tones, infrasound, ultrasound, etc.). Note the most prominent characteristics.
- Choose the most suitable instrumentation (type of sound level meter, noise dosimeter, filters, tape recorder, etc.).
- Check the instrument’s calibration and performance (batteries, calibration data, microphone corrections, etc.).
- Make notes or a sketch (if using a system) of the instrumentation, including model and serial numbers.
- Make a sketch of the noise environment to be measured, including major noise sources and the size and important characteristics of the room or outdoor setting.
- Measure the noise and note down the level measured for each weighting network or for each frequency band. Also note the meter response (such as “slow,” “fast,” “impulse,” etc.), and note the extent to which the meter fluctuates (e.g., plus or minus 2 dB).
If measurements are made outdoors, pertinent meteorological data, such as wind, temperature and humidity should be noted if they are considered important. A windscreen should always be used for outdoor measurements, and even for some indoor measurements. The manufacturer’s instructions should always be followed to avoid the influence of factors such as wind, moisture, dust and electrical and magnetic fields, which may affect the readings.
Measuring procedures
There are two basic approaches to measuring noise in the workplace:
- The exposure of each worker, worker type or worker representative may be measured. The noise dosimeter is the preferable instrument for this purpose.
- Noise levels may be measured in various areas, creating a noise map for the determination of risk areas. In this case, a sound level meter would be used to take readings at regular points in a coordinate network.
Worker Exposure Evaluation
To assess the risk of hearing loss from specific noise exposures, the reader should consult the international standard, ISO 1999 (1990). The standard contains an example of this risk assessment in its Annex D.
Noise exposures should be measured in the vicinity of the worker’s ear and, in assessing the relative hazard of workers’ exposures, subtractions should not be made for the attenuation provided by hearing protection devices. The reason for this caveat is that there is considerable evidence that the attenuation provided by hearing protectors as they are worn on the job is often less than half the attenuation estimated by the manufacturer. The reason for this is that the manufacturer’s data are obtained under laboratory conditions and these devices are not usually fitted and worn so effectively in the field. At the moment, there is no international standard for estimating the attenuation of hearing protectors as they are worn in the field, but a good rule of thumb would be to divide the laboratory values in half.
In some circumstances, especially those involving difficult tasks or jobs requiring concentration, it may be important to minimize the stress or fatigue related to noise exposure by adopting noise control measures. This may be true even for moderate noise levels (below 85 dBA), when there is little risk of hearing impairment, but the noise is annoying or fatiguing. In such cases it may be useful to perform loudness assessments using ISO 532 (1975), Method for Calculating Loudness Level.
Interference with speech communication may be estimated according to ISO 2204 (1979) using the “articulation index”, or more simply by measuring the sound levels in the octave bands centred at 500, 1,000 and 2,000 Hz, resulting in the “speech interference level”.
Exposure criteria
The selection of noise exposure criteria depends on the goal to be attained, such as the prevention of hearing loss or the prevention of stress and fatigue. Maximum permissible exposures in terms of daily average noise levels vary among nations from 80, to 85, to 90 dBA, with trading parameters (exchange rates) of 3, 4, or 5 dBA. In some countries, such as Russia, permissible noise levels are set anywhere from 50 to 80 dBA, according to the type of job performed and taking into account the mental and physical work load. For example, the allowable levels for computer work or the performance of demanding clerical work are 50 to 60 dBA. (For more information on exposure criteria, see the article “Standards and regulations” in this chapter.)
Engineering Noise Control
Ideally, the most effective means of noise control is to prevent the source of noise from entering into the plant environment in the first place—by establishing an effective “Buy Quiet” programme to furnish the workplace with equipment engineered for low noise output. To carry out such a programme, a clear, well-written statement of specifications for limiting noise characteristics of new plant equipment, facilities and processes must be designed to take the hazard of noise into account. A good programme builds in monitoring and maintenance as well.
Once equipment is installed and excess noise identified through sound level measurements, the problem of controlling noise becomes more complicated. However, there are engineering controls available which can be retrofitted to existing equipment. In addition, there is usually more than one noise control option for each problem. Therefore, it becomes important for the individual managing the noise control programme to determine the most feasible and economical means available for noise reduction in each given situation.
Controlling Noise in Factory and Product Design
The use of written specifications to define the requirements for equipment, its installation, and acceptance are standard practice in today’s environment. One of the foremost opportunities in the area of noise control available to the factory designer is to influence the selection, purchase and layout of new equipment. When properly written and administered, implementation of a “Buy Quiet” programme through purchase specifications can prove to be an effective means of controlling noise.
The most proactive approach towards controlling noise in the facility design and equipment procurement stage exists in Europe. In 1985, the twelve member states of the European Community (EC)—now the European Union (EU)— adopted “New Approach” Directives designed to address a broad class of equipment or machinery, rather than individual standards for each type of equipment. By the end of 1994 there had been three “New Approach” Directives issued that contain requirements on noise. These Directives are:
- Directive 89/392/EEC, with two amendments 91/368/EEC and 93/44/EEC
- Directive 89/106/EEC
- Directive 89/686/EEC, with one amendment 93/95/EEC.
The first item listed above (89/392/EEC) is commonly called the Machinery Directive. This Directive compels equipment manufacturers to include noise control as an essential part of machine safety. The basic aim of these measures is that for machinery or equipment to be sold within the EU, it must satisfy the essential requirements regarding noise. As a result, there has been a major emphasis on the design of low-noise equipment since the late 1980s by manufacturers interested in marketing within the EU.
For companies outside the EU attempting to implement a voluntary “Buy Quiet” programme, the degree of success achieved is largely dependent upon the timing and commitment of the entire management hierarchy. The first step in the programme is to establish acceptable noise criteria for construction of a new plant, expansion of an existing facility and purchase of new equipment. For the programme to be effective, the specified noise limits must be viewed by both the purchaser and vendor as an absolute requirement. When a product does not meet other equipment design parameters, such as size, flow rate, pressure, allowable temperature rise, and so forth, it is deemed unacceptable by company management. This is the same commitment that must be followed regarding noise levels in order to achieve a successful “Buy Quiet” programme.
As regards the timing aspect mentioned above, the earlier in the design process that consideration is given to the noise aspects of a project or equipment purchase, the greater the probability of success. In many situations, the factory designer or equipment buyer will have a choice of equipment types. Knowledge of the noise characteristics of the various alternatives will allow him or her to specify the quieter ones.
Besides selection of the equipment, early involvement in the design of the equipment layout within the plant is essential. Relocating equipment on paper during the design phase of a project is clearly much easier than physically moving the equipment later, especially once the equipment is in operation. A simple rule to follow is to keep machines, processes and work areas of approximately equal noise level together; and separate particularly noisy and particularly quiet areas by buffer zones having intermediate noise levels.
Validation of noise criteria as an absolute requirement requires a cooperative effort between company personnel from departments such as engineering, legal, purchasing, industrial hygiene and environment. For example, the industrial hygiene, safety, and/or personnel departments may determine the desired noise levels for equipment, as well as conduct sound surveys to qualify equipment. Next, company engineers may write the purchase specification, as well as select quiet types of equipment. The purchasing agent will most likely administer the contract and rely upon the law department representatives for assistance with enforcement. Involvement from all these parties should begin with the inception of the project and continue through funding requests, planning, design, bidding, installation and commissioning.
Even the most thorough and concise specification document is of little value unless the onus of compliance is placed on the supplier or manufacturer. Clear contract language must be used to define the means of determining compliance. Company procedures designed to enact guarantees should be consulted and followed. It may be desirable to include penalty clauses for non-compliance. Foremost in one’s enforcement strategy is the purchaser’s commitment to seeing that the requirements are met. Compromise on the noise criteria in exchange for cost, delivery date, performance, or other concessions should be the exception and not the rule.
Within the United States, ANSI has published the standard ANSI S12.16: Guidelines for the Specification of Noise of New Machinery (1992). This standard is a useful guide for writing an internal company noise specification. In addition, this standard provides direction for obtaining sound level data from equipment manufacturers. Once obtained from the manufacturer, the data may then be used by plant designers in planning equipment layouts. Because of the various types of distinctive equipment and tools for which this standard has been prepared, there is no single survey protocol appropriate for the measurement of sound level data. As a result, this standard contains reference information on the appropriate sound measurement procedure for testing a variety of stationary equipment. These survey procedures were prepared by the appropriate trade or professional organization in the United States responsible for a particular type or class of equipment.
Retrofitting Existing Equipment
Before one can decide what needs to be done, it becomes necessary to identify the root cause of noise. Towards this end, it is useful to have an understanding as to how noise is generated. Noise is created for the most part by mechanical impacts, high-velocity air flow, high-velocity fluid flow, vibrating surface areas of a machine, and quite often by the product being manufactured. As regards the lattermost item, it is often the case in manufacturing and process industries such as metal fabrication, glass manufacturing, food processing, mining, and so forth, that the interaction between the product and machines imparts the energy that creates the noise.
Source identification
One of the most challenging aspects of noise control is identification of the actual source. In a typical industrial setting there are usually multiple machines operating simultaneously, which makes it difficult to identify the root cause of noise. This is especially true when a standard sound level meter (SLM) is used to evaluate the acoustical environment. The SLM typically provides a sound pressure level (SPL) at a specific location, which is most likely the result of more than one noise source. Therefore, it becomes incumbent upon the surveyor to employ a systematic approach that will help separate out the individual sources and their relative contribution to the overall SPL. The following survey techniques may be used to help with identifying the origin or source of noise:
- Measure the frequency spectrum and graph the data.
- Measure the sound level, in dBA, as a function of time.
- Compare frequency data from similar equipment or production lines.
- Isolate components with temporary controls, or by turning on and off individual items whenever possible.
One of the most effective methods for locating the source of the noise is to measure its frequency spectrum. Once the data are measured, it is very useful to graph the results so that one can visually observe the characteristics of the source. For most noise abatement problems, the measurements can be accomplished with either full (1/1) or one-third (1/3) octave-band filters used with the SLM. The advantage of 1/3 octave-band measurement is that it provides more detailed information about what is emanating from a piece of equipment. Figure 1 exhibits a comparison between 1/1 and 1/3 octave-band measurements conducted near a nine-piston pump. As depicted in this figure, the 1/3 octave-band data clearly identifies the pumping frequency and many of its harmonics. If one used only 1/1, or full octave-band data, as depicted by the solid line and plotted at each centre-band frequency in figure 1, it becomes more difficult to diagnose what is occurring within the pump. With 1/1 octave-band data there are a total of nine data points between 25 Hertz (Hz) and 10,000 Hz, as shown in this figure. However, there are a total of 27 data points in this frequency range with the use of 1/3 octave-band measurements. Clearly, 1/3 octave-band data will provide more useful data towards identifying the root cause of a noise. This information is critical if the objective is to control noise at the source. If the only interest is to treat the path along which sound waves are transmitted, then 1/1 octave-band data will be sufficient for purposes of selecting acoustically appropriate products or materials.
Figure 1. Comparison between 1/1 and 1/3 octave-band data
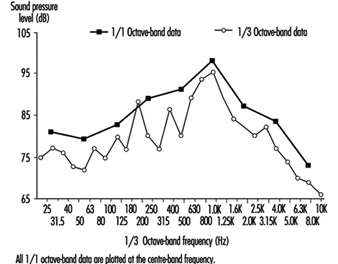
Figure 2 shows a comparison between the 1/3 octave-band spectrum measured 3 feet from the crossover pipe of a liquid chiller compressor and the background level measured approximately 25 feet away (please note the approximations given in the footnote). This position represents the general area where employees typically walk through this room. For the most part the compressor room is not routinely occupied by workers. The only exception exists when maintenance workers are repairing or overhauling other equipment in the room. Besides the compressor, there are several other large machines operating in this area. To assist with the identification of the primary noise sources, several frequency spectrums were measured near each of the equipment items. When each spectrum was compared to the data at the background position in the walkway, only the crossover pipe of the compressor unit exhibited a similar spectrum shape. Consequently, it may be concluded this is the primary noise source controlling the level measured at the employee walkway. So as depicted in figure 2, through the use of frequency data measured near the equipment and graphically comparing individual sources to the data recorded at employee workstations or other areas of interest, it is often possible to identify the dominant sources of noises clearly.
Figure 2. Comparison of crossover pipe versus background level
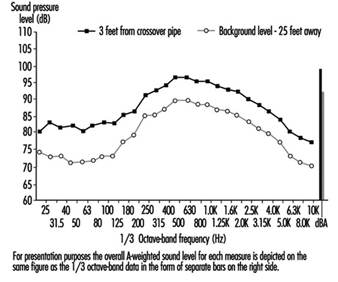
When the sound level fluctuates, as with cyclic equipment, it is useful to measure the overall A-weighted sound level versus time. With this procedure it is important to observe and document what events are occurring over time. Figure 3 exhibits the sound level measured at the operator’s workstation over one full machine cycle. The process depicted in figure 3 represents that of a product wrapping machine, which has a cycle time of approximately 95 seconds. As shown in the figure, the maximum noise level of 96.2 dBA occurs during the release of compressed air, 33 seconds into the machine cycle. The other important events are also labelled in the figure, which permits the identification of the source and relative contribution of each activity during the full wrapping cycle.
Figure 3. Workstation for packaging operator
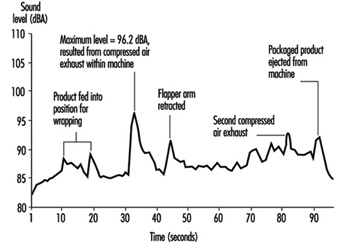
In industrial settings where there are multiple process lines with the same equipment, it is a worthwhile effort to compare the frequency data for similar equipment to one another. Figure 4 depicts this comparison for two similar process lines, both of which manufacture the same product and operate at the same speed. Part of the process involves the use of a pneumatically actuated device that punches a one-half inch hole in the product as a final phase in its production. Inspection of this figure clearly reveals that line #1 has an overall sound level 5 dBA higher than line #2. In addition, the spectrum depicted for line #1 contains a fundamental frequency and many harmonics that do not appear in the spectrum for line #2. Consequently, it is necessary to investigate the cause of these differences. Often significant differences will be an indication of the need for maintenance, such as was the situation for the final punch mechanism of line #2. However, this particular noise problem will require additional control measures since the overall level on line #1 is still relatively high. But the point of this survey technique is to identify the different noise problems that may exist between similar items of equipment and processes that may be easily remedied with effective maintenance or other adjustments.
Figure 4. Final punch operation for identical process lines
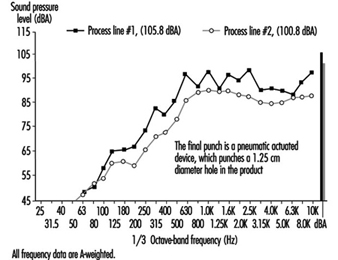
As mentioned above, an SLM typically provides an SPL that comprises acoustical energy from one or more noise sources. Under optimum measurement conditions, it would be best to measure each item of equipment with all other equipment turned off. Although this situation is ideal, it is rarely practical to shut down the plant to allow isolation of a particular source. In order to circumvent this limitation, it is often effective to use temporary control measures with certain noise sources that will provide some short-term noise reduction so as to allow measurement of another source. Some materials available that can provide a temporary reduction include plywood enclosures, acoustical blankets, silencers and barriers. Often, permanent application of these materials will create long-term problems such as heat build-up, interference with the operator’s access or product flow, or costly pressure drops associated with improperly selected silencers. However, for assisting with the isolation of individual components, these materials can be effective as a short-term control.
Another method available for isolating a particular machine or component is to turn different equipment on and off, or sections of a production line. To effectively conduct this type of diagnostic analysis the process must be capable of functioning with the selected item turned off. Next, for this procedure to be legitimate it is critical that the manufacturing process not be affected in any manner. If the process is affected, then it is entirely possible that the measurement will not be representative of the noise level under normal conditions. Finally, all valid data may then be ranked by magnitude of the overall dBA value to help prioritize equipment for engineering noise control.
Selecting the appropriate noise control options
Once the cause or source of noise is identified and it is known how it radiates to employee work areas, the next step is to decide what the available noise control options may be. The standard model used with respect to the control of almost any health hazard is to examine the various control options as they apply to the source, path and receiver. In some situations, control of one of these elements will be sufficient. However, under other circumstances it may be the case that treatment of more than one element is required to obtain an acceptable noise environment.
The first step in the noise control process should be to attempt some form of source treatment. In effect, source modification addresses the root cause of a noise problem, whereas control of the sound transmission path with barriers and enclosures only treats the symptoms of noise. In those situations where there are multiple sources within a machine and the objective is to treat the source, it will be necessary to address all noise-generating mechanisms on a component-by-component basis.
For excessive noise generated by mechanical impacts, the control options to investigate may include methods to reduce the driving force, reduce the distance between components, balance rotating equipment and install vibration isolation fittings. As regards noise arising from high-velocity air flow or fluid flow, the primary modification is to reduce the velocity of the medium, assuming this is a feasible option. Sometimes the velocity can be reduced by increasing the cross sectional area of the pipeline in question. Obstructions in the pipeline must be eliminated to allow for a streamlined flow, which in turn will reduce pressure variations and turbulence in the medium being transported. Finally, installation of a properly sized silencer or muffler can provide a significant reduction in the overall noise. The silencer manufacturer should be consulted for assistance with selection of the proper device, based on the operating parameters and constraints set forth by the purchaser.
When vibrating surface areas of a machine act as a sounding board for airborne noise, the control options include a reduction in the driving force associated with the noise, creation of smaller sections out of larger surface areas, perforation of the surface, increasing the substrate stiffness or mass, and application of damping material or vibration isolation fittings. As regards the use of vibration isolation and damping materials, the product manufacturer should be consulted for assistance with the selection of the appropriate materials and installation procedures. Finally, in many industries the actual product being manufactured will often be an efficient radiator of airborne sound. In these situations it is important to evaluate ways to tightly secure or better support the product during fabrication. Another noise control measure to investigate would be to reduce the impact force between the machine and product, between parts of the product itself, or between separate product items.
Often process or equipment redesign and source modification may prove to be infeasible. In addition, there may be situations when it is virtually impossible to identify the root cause of the noise. When any of these situations exist, the use of control measures for treatment of the sound transmission path would be an effective means for reducing the overall noise level. The two primary abatement measures for path treatments are acoustical enclosures and barriers.
The development of acoustical enclosures is well advanced in today’s marketplace. Both off-the-shelf and custom-made enclosures are available from several manufacturers. In order to procure the appropriate system it is necessary for the buyer to provide information as to the current overall noise level (and possibly frequency data), the dimensions of the equipment, the noise reduction goal, the need for product flow and employee access, and any other operating constraints. The vendor will then be able to use this information to select a stock item or fabricate a custom enclosure to satisfy the needs of the buyer.
In many situations it may be more economical to design and build an enclosure instead of purchasing a commercial system. In designing enclosures, many factors must be taken into consideration if the enclosure is to prove satisfactory from both an acoustical and a production point of view. Specific guidelines for enclosure design are as follows:
Enclosure dimensions. There is no critical guideline for the size or dimensions of an enclosure. The best rule to follow is the bigger the better. It is critical that sufficient clearance be provided to permit the equipment to perform all intended movement without contacting the enclosure.
Enclosure wall. The noise reduction provided by an enclosure is dependent upon the materials used in the construction of the walls and how tightly the enclosure is sealed. Selection of the appropriate materials for the enclosure wall should be determined using the following rules of thumb (Moreland 1979):
- for an enclosure, with no internal absorption:
TLreqd=NR+20 dBA
- with approximately 50% internal absorption:
TLreqd=NR+15 dBA
- with 100% internal absorption:
TLreqd=NR+10 dBA.
In these expressions TLreqd is the transmission loss required of the enclosure wall or panel, and NR is the noise reduction desired to meet the abatement goal.
Seals. For maximum efficiency, all enclosure wall joints must be tight fitting. Openings around pipe penetrations, electrical wiring and so on, should be sealed with non-hardening mastic such as silicon caulk.
Internal absorption. To absorb and dissipate acoustical energy the internal surface area of the enclosure should be lined with acoustically absorptive material. The frequency spectrum of the source should be used to select the appropriate material. The manufacturer’s published absorption data provides the basis for matching the material to the source of noise. It is important to match the maximum absorption factors to those frequencies of the source that have the highest sound pressure levels. The product vendor or manufacturer can also assist with selection of the most effective material based on the frequency spectrum of the source.
Enclosure isolation. It is important that the enclosure structure be separated or isolated from the equipment in order to ensure that mechanical vibration is not transmitted to the enclosure itself. When parts of the machine, such as pipe penetrations, do come in contact with the enclosure, it is important to include vibration isolation fittings at the point of contact to short-circuit any potential transmission path. Finally, if the machine causes the floor to vibrate then the base of the enclosure should also be treated with vibration isolation material.
Providing for product flow. As with most production equipment, there will be a need to move product into and out of the enclosure. The use of acoustically lined channels or tunnels can permit product flow and yet provide acoustical absorption. To minimize the leakage of noise, it is recommended that all passageways be three times longer than the inside width of the largest dimension of the tunnel or channel opening.
Providing for worker access. Doors and windows may be installed to provide physical and visual access to the equipment. It is critical that all windows have at least the same transmission loss properties as the enclosure walls. Next, all access doors must tightly seal around all edges. To prevent operation of the equipment with the doors open, it is recommended that an interlocking system be included that permits operation only when the doors are fully closed.
Ventilation of enclosure. In many enclosure applications, there will be excessive heat build-up. To pass cooling air through the enclosure, a blower with a capacity of 650 to 750 cubic feet/metres should be installed on the outlet or discharge duct. Finally, the intake and discharge ducts should be lined with absorptive material.
Protection of absorptive material. To prevent the absorptive material from becoming contaminated, a splash barrier should be applied over the absorptive lining. This should be of a very light material, such as one-mil plastic film. The absorptive layer should be retained with expanded metal, perforated sheet metal or hardware cloth. The facing material should have at least 25% open area.
An alternative sound transmission path treatment is to use an acoustic barrier to block or shield the receiver (the worker at risk of the noise hazard) from the direct sound path. An acoustic barrier is a high transmission loss material, such as a solid partition or wall, inserted between the noise source and the receiver. By blocking the direct line-of-sight path to the source, the barrier causes the sound waves to reach the receiver by reflection off various surfaces in the room and by diffraction at the edges of the barrier. As a result, the overall noise level is reduced at the receiver’s location.
The effectiveness of a barrier is a function of its location relative to the noise source or receivers and of its overall dimensions. To maximize the potential noise reduction, the barrier should be located as closely as practical to either the source or receiver. Next, the barrier should be as tall and wide as possible. To block the sound path effectively, a high-density material, on the order of 4 to 6 lb/ft3, should be used. Finally, the barrier should not contain any openings or gaps, which can significantly reduce its effectiveness. If it is necessary to include a window for visual access to the equipment, then it is important that the window have a sound transmission rating at least equivalent to that of the barrier material itself.
The final option for reducing worker noise exposure is to treat the space or area where the employee works. This option is most practical for those job activities, such as product inspection or equipment monitoring stations, where employee movement is confined to a relatively small area. In these situations, an acoustical booth or shelter may be installed to isolate the employees and provide relief from excessive noise levels. Daily noise exposures will be reduced as long as a significant portion of the workshift is spent inside the shelter. To construct such a shelter, the previously described guidelines for enclosure design should be consulted.
In conclusion, implementation of an effective “Buy Quiet” programme should be the initial step in a total noise control process. This approach is designed to prevent the purchase or installation of any equipment that might present a noise problem. However, for those situations where excessive noise levels already exist, it is then necessary to evaluate the noise environment systematically in order to develop the most practical engineering control option for each individual noise source. In determining the relative priority and urgency of implementing noise control measures, employee exposures, occupancy of the space, and overall area noise levels should be considered. Obviously, an important aspect of the desired result is to obtain the maximum employee noise exposure reduction for the monetary funds invested and that the greatest degree of employee protection is secured at the same time.
Hearing Conservation Programmes
The authors thank the North Carolina Department of Labor for permission to re-use materials developed during the writing of an NCDOL industry guide on hearing conservation.
The primary objective of occupational hearing conservation programmes (HCPs) is to prevent on-the-job noise-induced hearing loss due to hazardous workplace noise exposures (Royster and Royster 1989 and 1990). However, the person—who shall later be characterized as the “key individual”—who is responsible for making the HCP effective should use common sense to modify these practices to fit the local situation in order to achieve the desired goal: protection of workers from harmful occupational noise exposures. A secondary objective of these programmes should be to so educate and motivate individuals that they also elect to protect themselves from harmful non-occupational noise exposures and translate their knowledge about hearing conservation to their families and friends.
Figure 1 shows the distributions of over 10,000 noise exposure samples from four sources in two countries, including a variety of industrial, mining and military work environments. The samples are 8-hour time-weighted-average values based on exchange rates of 3, 4 and 5 dB. These data indicate that about 90% of daily equivalent noise exposures are 95 dBA or below, and only 10% exceed 95 dBA.
Figure 1. Estimated noise exposure hazard for different populations
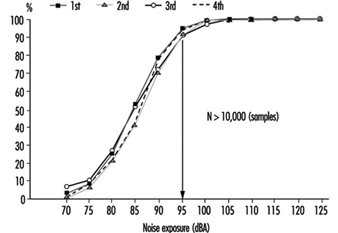
The importance of the data in figure 1, assuming that they apply to most countries and populations, is simply that a vast majority of noise-exposed employees need to achieve only 10 dBA of protection from noise to eliminate the hazard. When hearing protection devices (HPDs) are worn to achieve this protection, those responsible for worker health must take the time to fit each individual with a device that is comfortable, practical for the environment, takes into account the individual’s auditory needs (ability to hear warning signals, speech, etc.), and provides an acoustic seal when worn day in and day out in real-world environments.
This article presents a condensed set of good hearing conservation practices, as summarized in the checklist presented in figure 2.
Figure 2. Checklist of good HCP practices
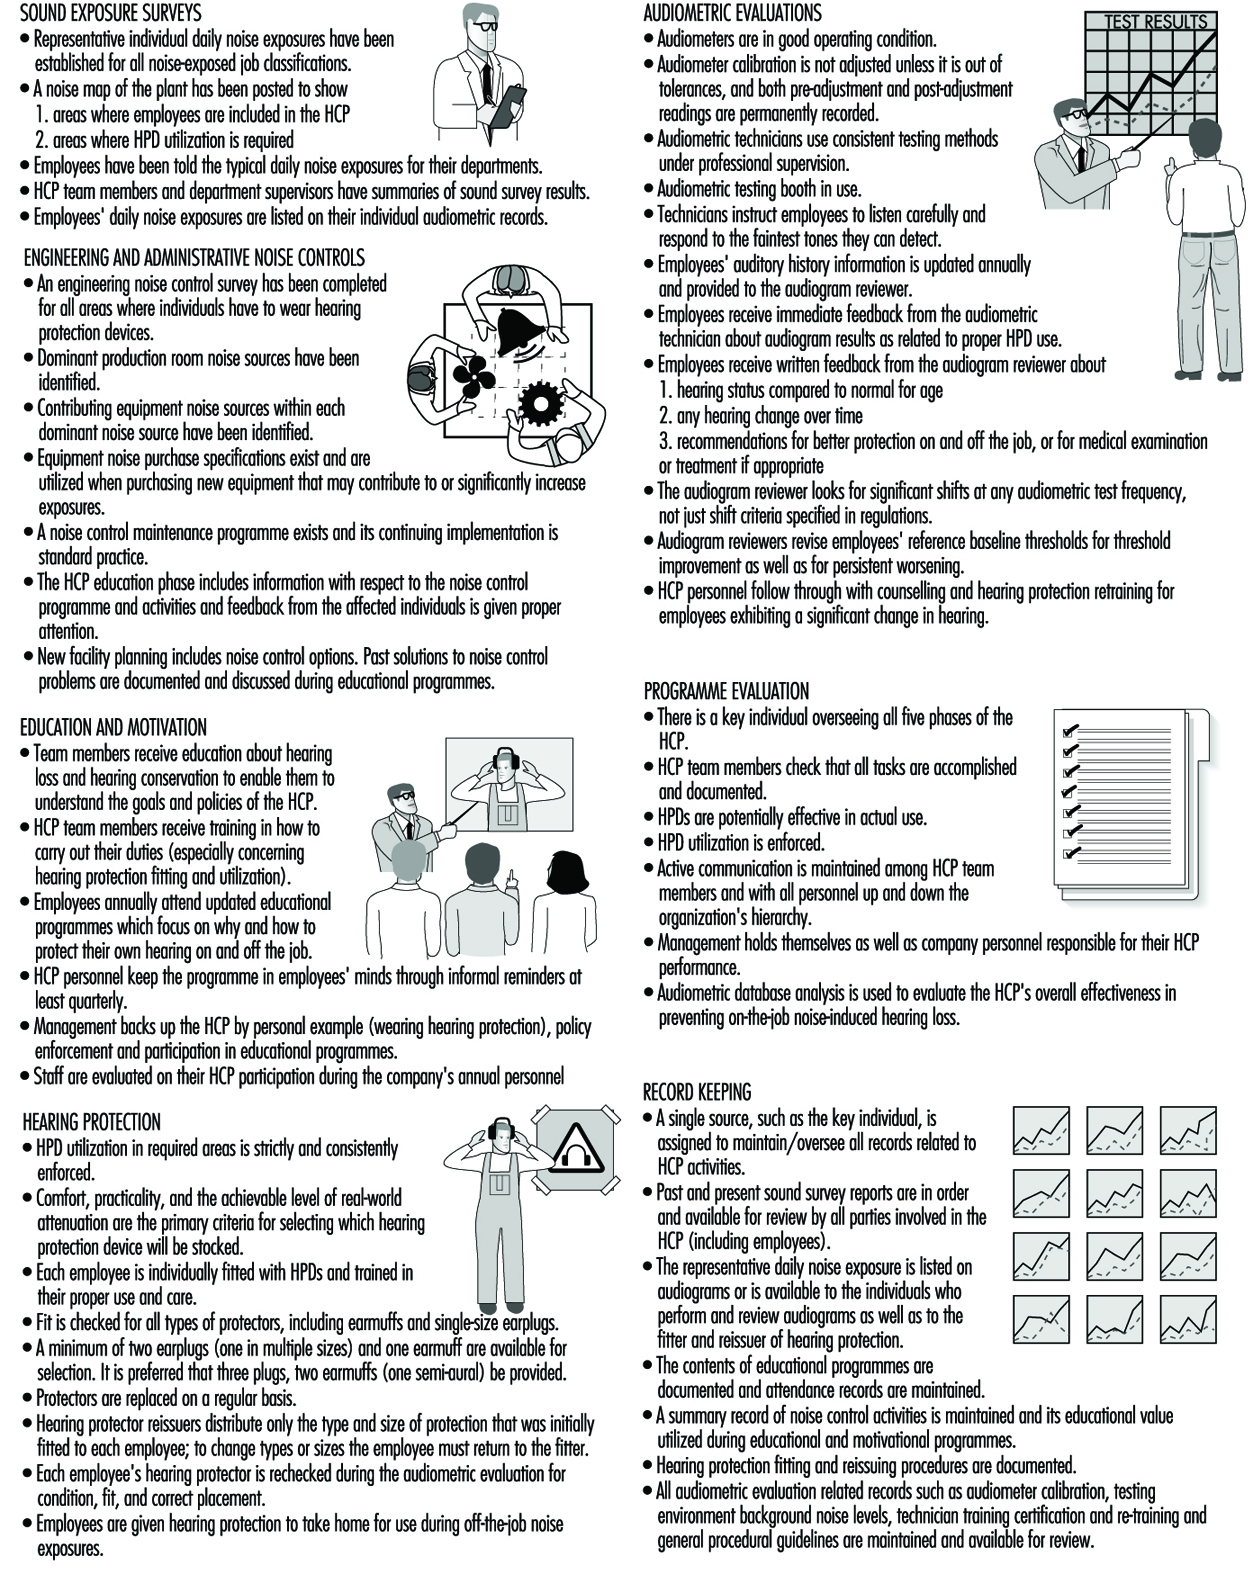
Benefits of Hearing Conservation
Prevention of occupational hearing loss benefits the employee by preserving hearing abilities which are critical to good quality of life: interpersonal communication, enjoyment of music, detection of warning sounds, and many more. The HCP provides a health screening benefit, since non-occupational hearing losses and potentially treatable ear diseases are often detected through annual audiograms. Lowering noise exposure also reduces potential stress and fatigue related to noise.
The employer benefits directly by implementing an effective HCP which maintains employees’ good hearing, since workers will remain more productive and more versatile if their communication abilities are not impaired. Effective HCPs can reduce accident rates and promote work efficiency.
Phases of an HCP
Refer to the checklist in the figure 2 for details of each phase. Different personnel may be responsible for different phases, and these personnel comprise the HCP team.
Sound exposure surveys
Sound level meters or personal noise dosimeters are used to measure workplace sound levels and estimate workers’ noise exposures to determine if an HCP is needed; if so, the data so gathered will help establish appropriate HCP policies to protect employees (Royster, Berger and Royster 1986). Survey results identify which employees (by department or job) will be included in the HCP, which areas should be posted for required hearing protector use, and which hearing protection devices are adequate. Adequate samples of representative production conditions are needed to classify exposures into ranges (below 85 dBA, 85-89, 90-94, 95-99 dBA, etc.). The measurement of A-weighted sound levels during the general noise survey often identifies dominant noise sources in areas of the plant where follow-up engineering noise control studies may significantly reduce employee exposures.
Engineering and administrative noise controls
Noise controls may reduce employees’ noise exposures to a safe level, eliminating the need for a hearing conservation programme. Engineering controls (see “Engineering noise control” [NOI03AE] in this chapter) involve modifications of the noise source (such as fitting mufflers to air exhaust nozzles), the noise path (such as placing sound-blocking enclosures around equipment) or the receiver (such as constructing an enclosure around the employee’s workstation). Worker input is often needed in designing such modifications to ensure that they are practical and will not interfere with his or her tasks. Obviously, hazardous employee noise exposures should be reduced or eliminated by means of engineering noise controls whenever practical and feasible.
Administrative noise controls include replacement of old equipment with quieter new models, adherence to equipment maintenance programmes related to noise control, and changes in employee work schedules to reduce noise doses by limiting exposure time when practical and technically advisable. Planning and designing to achieve non-hazardous noise levels when new production facilities are brought on-line is an administrative control which can also eliminate the need for an HCP.
Education and motivation
HCP team members and employees will not actively participate in hearing conservation unless they understand its purpose, how they will benefit directly from the programme, and that compliance with the company’s safety and health requirements is a condition of employment. Without meaningful education to motivate individual actions, the HCP will fail (Royster and Royster 1986). Topics to be covered should include the following: the purpose and benefits of the HCP, sound survey methods and results, using and maintaining engineering noise control treatments to reduce exposures, hazardous off-the-job noise exposures, how noise damages hearing, consequences of hearing loss in daily life, selection and fitting of hearing protection devices and importance of consistent wear, how audiometric testing identifies hearing changes to indicate the need for greater protection and the employer’s HCP policies. Ideally, these topics can be explained to small groups of employees in safety meetings, given ample time for questions. In effective HCPs the educational phase is a continuous process—not just an annual presentation—as HCP personnel take daily opportunities to remind others about conserving their hearing.
Hearing protection
The employer provides hearing protection devices (earplugs, earmuffs, and semi-insert devices) for employees to wear as long as hazardous noise levels exist in the workplace. Because feasible engineering noise controls have not been developed for many types of industrial equipment, hearing protectors are the best current option for preventing noise-induced hearing loss in these situations. As indicated earlier, most noise-exposed workers need to achieve only 10 dB of attenuation to be adequately protected from noise. With the large selection of hearing protectors available today, adequate protection can be readily achieved (Royster 1985; Royster and Royster 1986) if devices are individually fitted to each employee to achieve an acoustic seal with acceptable comfort, and if the worker is taught how to wear the device correctly to maintain an acoustic seal, but consistently whenever a noise hazard exists.
Audiometric evaluations
Each exposed individual should receive a baseline hearing check followed by annual rechecks to monitor hearing status and detect any hearing change. An audiometer is used in a sound-attenuating booth to test the employee’s hearing thresholds at 0.5, 1, 2, 3, 4, 6 and 8 kHz. If the HCP is effective, employees’ audiometric results will not show significant changes associated with on-the-job noise-induced hearing damage. If suspicious hearing changes are found, the audiometric technician and the audiologist or physician who reviews the record can counsel the employee to wear HPDs more carefully, assess whether better-fitting HPDs are needed and motivate the individual to be more careful in protecting his or her hearing both on and off the job. Sometimes non-occupational causes of hearing change may be identified, such as gunfire or hobby noise exposure, or medical ear problems. Audiometric monitoring is useful only if quality control of testing procedures is maintained and if the results are used to trigger follow-up for individuals with significant hearing changes (Royster 1985).
Record Keeping
Requirements for the type of records to be kept and the duration for maintaining them vary among countries. In countries where litigation concerns and worker’s compensation are important issues, records should be maintained longer than required by occupational regulations since they are often useful for legal purposes. The goal of record keeping is to document how employees have been protected from noise (Royster and Royster 1989 and 1990). Especially important records include the sound survey procedures and findings, audiometric calibration and results, follow-up actions in response to employees’ hearing changes and documentation of hearing protector fitting and training. Records should include the names of the personnel who carried out the HCP tasks as well as the results.
Programme Evaluation
Characteristics of effective programmes
Successful HCPs share the following characteristics and promote a “safety culture” with respect to all safety programmes (safety eyeglasses, “hard hats”, safe lifting behaviour, etc.).
The “key individual”
The most important strategy for making the five phases of the HCP function together effectively is to unite them under the supervision of one individual of central importance (Royster and Royster 1989 and 1990). In smaller companies where one person may actually carry out all facets of the HCP, lack of coordination is not usually a problem. However, as the size of the organization increases, different types of staff become involved in the HCP: safety personnel, medical personnel, engineers, industrial hygienists, tool crib supervisors, production supervisors and others. With personnel from varying disciplines carrying out different aspects of the programme, it becomes very difficult to coordinate their efforts unless one “key individual” is able to oversee the entire HCP. The choice of who this person should be is critical to the success of the programme. One of the primary qualifications for the key individual is genuine interest in the company’s HCP.
The key individual is always approachable and is sincerely interested in comments or complaints that can help to improve the HCP. This individual does not take a remote attitude or stay in an office, running the HCP on paper by mandate, but spends time on the production floors or wherever workers are active in order to interact with them and observe how problems can be prevented or solved.
Active communications and roles
The primary HCP team members should meet together regularly to discuss the progress of the programme and ensure that all duties are being carried out. Once people with different tasks understand how their own roles contribute to the overall outcome of the programme, they will cooperate better to prevent hearing loss. The key individual can achieve this active communication and cooperation if management provides him or her with the authority to make HCP decisions and the resource allocations to act on decisions once they are made. The success of the HCP depends on everyone from the top boss to the most recently hired trainee; everyone has an important role. Management’s role is largely to support the HCP and enforce its policies as one facet of the company’s overall health and safety programme. For middle managers and supervisors the role is more direct: they help carry out the five phases. The role of employees is to participate actively in the programme and be aggressive in making suggestions to improve HCP operation. However, for employee participation to succeed, management and the HCP team must be receptive to comments and actually respond to employee input.
Hearing protectors—effective and enforced
The importance of hearing protection policies to HCP success is underscored by two desired characteristics of effective HCPs: strict enforcement of hearing protector utilization (there must be actual enforcement, not just a paper policy) and the availability of protectors which are potentially effective for use by the wearers in the work environment. Potentially effective devices are practical and comfortable enough for employees to wear consistently, and they provide adequate sound attenuation without impairing communication through overprotection.
Limited external influences on the HCP
If local HCP decisions are limited by policies mandated by corporate headquarters, the key individual may need top management’s assistance in obtaining exceptions to the corporate or external rules in order to meet local needs. The key individual also must keep strict control over any services provided by outside consultants, contractors or government officials (such as sound surveys or audiograms). When contractors are used, it is more difficult to integrate their services cohesively into the overall HCP, but it is critical to do so. If in-plant personnel do not follow through by using the information provided by the contractors, then the contracted elements of the programme lose effectiveness. Experience clearly indicates that it is very difficult to establish and maintain an effective HCP which depends predominantly on external contractors.
In contrast to the previous characteristics, the following is a listing of some common causes of HCP ineffectiveness.
- inadequate communication and coordination among HCP personnel
- insufficient or erroneous information used to make decisions
- inadequate training for hearing protector fitters and issuers
- inadequate or inappropriate selection of protectors in stock
- over-reliance on number ratings in choosing devices
- failure to fit and train each HPD wearer individually
- over-reliance on external sources (government or contractors) to provide HCP services
- failure to use audiometric monitoring results to educate and motivate employees
- failure to use audiometric data to evaluate HCP effectiveness.
Objective evaluation of the audiometric data
The audiometric data for the noise-exposed population provide evidence of whether the HCP is preventing occupational hearing loss. Over time, the rate of hearing change for noise-exposed employees should be no greater than that of matched controls without noisy jobs. To give an early indication of HCP effectiveness, procedures for audiometric database analysis have been developed using year-to-year variability in threshold values (Royster and Royster 1986; ANSI 1991).
Standards and Regulations
Terms
In the field of occupational noise, the terms regulation, standard, and legislation are often used interchangeably, even though technically they may have slightly different meanings. A standard is a codified set of rules or guidelines, much like a regulation, but it can be developed under the auspices of a consensus group, such as the International Organization for Standardization (ISO). Legislation consists of laws prescribed by legislating authorities or by local governing bodies.
Many national standards are called legislation. Some official bodies use the terms standards and regulations as well. The Council of the European Communities (CEC) issues Directives. All members of the European Community needed to “harmonize” their noise standards (regulations or legislation) with the 1986 EEC Directive on occupational noise exposure by the year 1990 (CEC 1986). This means that the noise standards and regulations of the member countries had to be at least as protective as the EEC Directive. In the United States, a regulation is a rule or order prescribed by a government authority and is usually more in the nature of a formality than a standard.
Some nations have a code of practice, which is somewhat less formal. For example, the Australian national standard for occupational exposure to noise consists of two short paragraphs setting forth mandatory rules, followed by a 35-page code of practice which provides practical guidance on how the standard should be implemented. Codes of practice usually do not have the legal force of regulations or legislation.
Another term that is used occasionally is recommendation, which is more like a guideline than a mandatory rule and is not enforceable. In this article, the term standard will be used generically to represent noise standards of all degrees of formality.
Consensus Standards
One of the most widely used noise standards is ISO 1999, Acoustics: Determination of Occupational Noise Exposure and Estimate of Noise-Induced Hearing Impairment (ISO 1990). This international consensus standard represents a revision of an earlier, less detailed version and it can be used to predict the amount of hearing loss expected to occur in various centiles of the exposed population at various audiometric frequencies as a function of exposure level and duration, age and sex.
The ISO is currently very active in the area of noise standardization. Its technical committee TC43, “Acoustics”, is working on a standard to evaluate the effectiveness of hearing conservation programmes. According to von Gierke (1993), TC43’s Subcommittee 1 (SC1) has 21 working groups, some of which are considering more than three standards each. TC43/SC1 has issued 58 noise-related standards and 63 additional standards are in a state of revision or preparation (von Gierke 1993).
Damage-Risk Criteria
The term damage-risk criteria refers to the risk of hearing impairment from various levels of noise. Many factors enter into the development of these criteria and standards in addition to the data describing the amount of hearing loss resulting from a certain amount of noise exposure. There are both technical and policy considerations.
The following questions are good examples of policy considerations: What proportion of the noise-exposed population should be protected, and how much hearing loss constitutes an acceptable risk? Should we protect even the most sensitive members of the exposed population against any loss of hearing? Or should we protect only against a compensable hearing handicap? It amounts to a question of which hearing loss formula to use, and different governmental bodies have varied widely in their selections.
In earlier years, regulatory decisions were made that allowed substantial amounts of hearing loss as an acceptable risk. The most common definition used to be an average hearing threshold level (or “low fence”) of 25 dB or greater at the audiometric frequencies 500, 1,000, and 2,000 Hz. Since that time, the definitions of “hearing impairment” or “hearing handicap” have become more restrictive, with different nations or consensus groups advocating different definitions. For example, certain US government agencies now use 25 dB at 1,000, 2,000, and 3,000 Hz. Other definitions may incorporate a low fence of 20 or 25 dB at 1,000, 2,000, and 4,000 Hz, and may include a broader range of frequencies.
In general, as definitions include higher frequencies and lower “fences” or hearing threshold levels, the acceptable risk becomes more stringent and a higher percentage of the exposed population will appear to be at risk from given levels of noise. If there is to be no risk of any hearing loss from noise exposure, even in the more sensitive members of the exposed population, the permissible exposure limit would have to be as low as 75 dBA. In fact, the EEC Directive has established an equivalent level (Leq) of 75 dBA as the level at which the risk is negligible, and this level has also been put forward as a goal for Swedish production facilities (Kihlman 1992).
Overall, the prevailing thought on this subject is that it is acceptable for a noise-exposed workforce to lose some hearing, but not too much. As for how much is too much, there is no consensus at this time. In all probability, most nations draft standards and regulations in an attempt to keep the risk at a minimum level while taking technical and economic feasibility into account, but without coming to consensus on such matters as the frequencies, fence, or percentage of the population to be protected.
Presenting the Damage-Risk Criteria
Criteria for noise-induced hearing loss may be presented in either of two ways: noise-induced permanent threshold shift (NIPTS) or percentage risk. NIPTS is the amount of permanent threshold shift remaining in a population after subtracting the threshold shift that would occur “normally” from causes other than occupational noise. The percentage risk is the percentage of a population with a certain amount of noise-induced hearing impairment after subtracting the percentage of a similar population not exposed to occupational noise. This concept is sometimes called excess risk. Unfortunately, neither method is without problems.
The trouble with using NIPTS alone is that it is difficult to summarize the effects of noise on hearing. The data are usually set out in a large table showing noise-induced threshold shift for each audiometric frequency as a function of noise level, years of exposure and population centile. The concept of percentage risk is more attractive because it uses single numbers and appears easy to understand. But the trouble with percentage risk is that it can vary enormously depending on a number of factors, particularly the height of the hearing threshold level fence and the frequencies used to define hearing impairment (or handicap).
With both methods, the user needs to be sure that the exposed and non-exposed populations are carefully matched for such factors as age and non-occupational noise exposure.
National Noise Standards
Table 1 gives some of the main features of the noise exposure standards of several nations. Most of the information is current as of this publication, but some standards may have been recently revised. Readers are advised to consult the newest versions of the national standards.
Table 1. Permissible exposure limits (PEL), exchange rates, and other requirements for noise exposure according to nation
|
Nation, date |
PEL Lav., 8-hour, dBAa |
Exchange rate, dBAb |
Lmax rms Lpeak SPL |
Level dBA engineering controlc |
Level dBA audiometric testc |
|
Argentina |
90 |
3 |
110 dBA |
||
|
Australia,1 1993 |
85 |
3 |
140 dB peak |
85 |
85 |
|
Brazil, 1992 |
85 |
5 |
115 dBA |
85 |
|
|
Canada,2 1990 |
87 |
3 |
87 |
84 |
|
|
CEC,3, 4 1986 |
85 |
3 |
140 dB peak |
90 |
85 |
|
Chile |
85 |
5 |
115 dBA |
||
|
China,5 1985 |
70-90 |
3 |
115 dBA |
||
|
Finland, 1982 |
85 |
3 |
85 |
||
|
France, 1990 |
85 |
3 |
135 dB peak |
85 |
|
|
Germany,3, 6 1990 |
85 |
3 |
140 dB peak |
90 |
85 |
|
Hungary |
85 |
3 |
125 dBA |
90 |
|
|
India,7 1989 |
90 |
115 dBA |
|||
|
Israel, 1984 |
85 |
5 |
115 dBA |
||
|
Italy, 1990 |
85 |
3 |
140 dB peak |
90 |
85 |
|
Netherlands, 8 1987 |
80 |
3 |
140 dB peak |
85 |
|
|
New Zealand,9 1981 |
85 |
3 |
115 dBA |
||
|
Norway,10 1982 |
85 |
3 |
110 dBA |
80 |
|
|
Spain, 1989 |
85 |
3 |
140 dB peak |
90 |
80 |
|
Sweden, 1992 |
85 |
3 |
115 dBA |
85 |
85 |
|
United Kingdom, 1989 |
85 |
3 |
140 dB peak |
90 |
85 |
|
United States,11 1983 |
90 |
5 |
115 dBA |
90 |
85 |
|
Uruguay |
90 |
3 |
110 dBA |
a PEL = Permissible exposure limit.
b Exchange rate. Sometimes called the doubling rate or time/intensity trading ratio, this is the amount of change in noise level (in dB) allowed for each halving or doubling of exposure duration.
c Like the PEL, the levels initiating the requirements for engineering controls and audiometric testing also, presumably, are average levels.
Sources: Arenas 1995; Gunn; Embleton 1994; ILO 1994. Published standards of various nations have been further consulted.
Notes to table 1.
1 Levels for engineering controls, hearing tests, and other elements of the hearing conservation programme are defined in a code of practice.
2 There is some variation among the individual Canadian provinces: Ontario, Quebec and New Brunswick use 90 dBA with a 5-dB exchange rate; Alberta, Nova Scotia and Newfoundland use 85 dBA with a 5-dB exchange rate; and British Columbia uses 90 dBA with a 3-dB exchange rate. All require engineering controls to the level of the PEL. Manitoba requires certain hearing conservation practices above 80 dBA, hearing protectors and training on request above 85 dBA, and engineering controls above 90 dBA.
3 The Council of the European Communities (86/188/EEC) and Germany (UVV Larm-1990) state that it is not possible to give a precise limit for the elimination of hearing hazards and the risk of other health impairments from noise. Therefore the employer is obliged to reduce the noise level as far as possible, taking technical progress and the availability of control measures into account. Other EC nations may have adopted this approach as well.
4 Those countries comprised by the European Community were required to have standards that at least conformed to the EEC Directive by January 1, 1990.
5 China requires different levels for different activities: e.g., 70 dBA for precision assembly lines, processing workshops and computer rooms; 75 dBA for duty, observation and rest rooms; 85 dBA for new workshops; and 90 dBA for existing workshops.
6 Germany also has noise standards of 55 dBA for mentally stressful tasks and 70 dBA for mechanized office work.
7 Recommendation.
8 The Netherlands’ noise legislation requires engineering noise control at 85 dBA “unless this cannot be reasonably demanded”. Hearing protection must be provided above 80 dBA and workers are required to wear it at levels above 90 dBA.
9 New Zealand requires a maximum of 82 dBA for a 16-hour exposure. Ear muffs must be worn in noise levels exceeding 115 dBA.
10 Norway requires a PEL of 55 dBA for work requiring a large amount of mental concentration, 85 dBA for work requiring verbal communication or great accuracy and attention, and 85 dBA for other noisy work settings. Recommended limits are 10 dB lower. Workers exposed to noise levels greater than 85 dBA should wear hearing protectors.
11 These levels apply to the OSHA noise standard, covering workers in general industry and the maritime trades. The US military services require standards that are somewhat more stringent. The US Air Force and the US Army both use an 85-dBA PEL and a 3-dB exchange rate.
Table 1 clearly shows the trend of most nations to use a permissible exposure limit (PEL) of 85 dBA, whereas about half of the standards still use 90 dBA for compliance with requirements for engineering controls, as allowed by the EEC Directive. The vast majority of the nations listed above have adopted the 3-dB exchange rate, except for Israel, Brazil and Chile, all of which use the 5-dB rule with an 85-dBA criterion level. The other notable exception is the United States (in the civilian sector), although both the US Army and the US Air Force have adopted the 3-dB rule.
In addition to their requirements to protect workers against hearing loss, several nations include provisions for preventing other adverse effects of noise. Some nations state the need to protect against the extra-auditory effects of noise in their regulations. Both the EEC Directive and the German standard acknowledge that workplace noise involves a risk for the health and safety of workers beyond hearing loss, but that current scientific knowledge of the extra-auditory effects does not enable precise safe levels to be set.
The Norwegian standard includes a requirement that noise levels must not exceed 70 dBA in work settings where speech communication is necessary. The German standard advocates noise reduction for the prevention of accident risks, and both Norway and Germany require a maximum noise level of 55 dBA to enhance concentration and prevent stress during mental tasks.
Some countries have special noise standards for different kinds of workplaces. For example, Finland and the United States have noise standards for motor vehicle cabs, Germany and Japan specify noise levels for offices. Others include noise as one of many regulated hazards in a particular process. Still other standards apply to specific types of equipment or machines, such as air compressors, chain saws and construction equipment.
In addition, some nations have promulgated separate standards for hearing protection devices (such as the EEC Directive, the Netherlands and Norway) and for hearing conservation programmes (such as France, Norway, Spain, Sweden and the United States.)
Some nations use innovative approaches to attack the occupational noise problem. For example, the Netherlands has a separate standard for newly constructed workplaces, and Australia and Norway give information to employers for instructing manufacturers in the provision of quieter equipment.
There is little information about the degree to which these standards and regulations are enforced. Some specify that employers “should” take certain actions (as in codes of practice or guidelines), while most specify that employers “shall”. Standards that use “shall” are more apt to be mandatory, but individual nations vary widely in their ability and inclination to secure enforcement. Even within the same nation, enforcement of occupational noise standards may vary considerably with the government in power.
More...
Introduction
Ionizing radiation is everywhere. It arrives from outer space as cosmic rays. It is in the air as emissions from radioactive radon and its progeny. Naturally occurring radioactive isotopes enter and remain in all living things. It is inescapable. Indeed, all species on this planet evolved in the presence of ionizing radiation. While humans exposed to small doses of radiation may not immediately show any apparent biological effects, there is no doubt that ionizing radiation, when given in sufficient amounts, can cause harm. These effects are well known both in kind and in degree.
While ionizing radiation can cause harm, it also has many beneficial uses. Radioactive uranium generates electricity in nuclear power plants in many countries. In medicine, x rays produce radiographs for diagnosis of internal injuries and diseases. Nuclear medicine physicians use radioactive material as tracers to form detailed images of internal structures and to study metabolism. Therapeutic radiopharmaceuticals are available to treat disorders such as hyperthyroidism and cancer. Radiotherapy physicians use gamma rays, pion beams, electron beams, neutrons and other types of radiation to treat cancer. Engineers use radioactive material in oil well logging operations and in soil moisture density gauges. Industrial radiographers use x rays in quality control to look at internal structures of manufactured devices. Exit signs in buildings and aircraft contain radioactive tritium to make them glow in the dark in the event of a power failure. Many smoke detectors in homes and commercial buildings contain radioactive americium.
These many uses of ionizing radiation and radioactive materials enhance the quality of life and help society in many ways. The benefits of each use must always be compared with the risks. The risks may be to workers directly involved in applying the radiation or radioactive material, to the public, to future generations and to the environment or to any combination of these. Beyond political and economic considerations, benefits must always outweigh risks when ionizing radiation is involved.
Ionizing Radiation
Ionizing radiation consists of particles, including photons, which cause the separation of electrons from atoms and molecules. However, some types of radiation of relatively low energy, such as ultraviolet light, can also cause ionization under certain circumstances. To distinguish these types of radiation from radiation that always causes ionization, an arbitrary lower energy limit for ionizing radiation usually is set around 10 kiloelectron volts (keV).
Directly ionizing radiation consists of charged particles. Such particles include energetic electrons (sometimes called negatrons), positrons, protons, alpha particles, charged mesons, muons and heavy ions (ionized atoms). This type of ionizing radiation interacts with matter primarily through the Coulomb force, repelling or attracting electrons from atoms and molecules by virtue of their charges.
Indirectly ionizing radiation consists of uncharged particles. The most common kinds of indirectly ionizing radiation are photons above 10 keV (x rays and gamma rays) and all neutrons.
X-ray and gamma-ray photons interact with matter and cause ionization in at least three different ways:
- Lower-energy photons interact mostly via the photoelectric effect, in which the photon gives all of its energy to an electron, which then leaves the atom or molecule. The photon disappears.
- Intermediate-energy photons mostly interact through the Compton effect, in which the photon and an electron essentially collide as particles. The photon continues in a new direction with reduced energy while the released electron goes off with the remainder of the incoming energy (less the electron’s binding energy to the atom or molecule).
- Pair production is possible only for photons with energy in excess of 1.02 MeV. (However, near 1.02 MeV, the Compton effect still dominates. Pair production dominates at higher energies.) The photon disappears and an electron-positron pair appears in its place (this occurs only in the vicinity of a nucleus because of conservation of momentum and energy considerations). The total kinetic energy of the electron-positron pair is equal to the energy of the photon less the sum of the rest-mass energies of the electron and positron (1.02 MeV). These energetic electrons and positrons then proceed as directly ionizing radiation. As it loses kinetic energy, a positron will eventually encounter an electron, and the particles will annihilate each other. Two (usually) 0.511 MeV photons are then emitted from the annihilation site at 180 degrees from each other.
a given photon any of these can occur, except that pair production is possible only for photons with energy greater than 1.022 MeV. The energy of the photon and the material with which it interacts determine which interaction is the most likely to occur.
Figure 1 shows the regions in which each type of photon interaction dominates as a function of photon energy and atomic number of absorber.
Figure 1. Relative importance of the three principal interactions of photons in matter
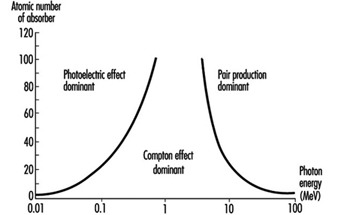
The most common neutron interactions with matter are inelastic collisions, neutron capture (or activation) and fission. All of these are interactions with nuclei. A nucleus colliding inelastically with a neutron is left at a higher energy level. It can release this energy in the form of a gamma ray or by emitting a beta particle, or both. In neutron capture, an affected nucleus may absorb the neutron and eject energy as gamma or x rays or beta particles, or both. The secondary particles then cause ionization as discussed above. In fission, a heavy nucleus absorbs the neutron and splits into two lighter nuclei that are almost always radioactive.
Quantities, Units and Related Definitions
The International Commission on Radiation Units and Measurements (ICRU) develops internationally accepted formal definitions of quantities and units of radiation and radioactivity. The International Commission on Radiological Protection (ICRP) also sets standards for definition and use of various quantities and units used in radiation safety. A description of some quantities, units and definitions commonly used in radiation safety follows.
Absorbed dose. This is the fundamental dosimetric quantity for ionizing radiation. Basically, it is the energy ionizing radiation imparts to matter per unit mass. Formally,
![]()
where D is the absorbed dose, de is the mean energy imparted to matter of mass dm. Absorbed dose has units of joules per kilogram (J kg–1). The special name for the unit of absorbed dose is the gray (Gy).
Activity. This quantity represents the number of nuclear transformations from a given nuclear energy state per unit time. Formally,
![]()
where A is the activity, dN is the expectation value of the number of spontaneous nuclear transitions from the given energy state in the time interval dt. It is related to the number of radioactive nuclei N by:
![]()
where l is the decay constant. Activity has units of inverse seconds (s–1). The special name for the unit of activity is the becquerel (Bq).
Decay constant (l). This quantity represents the probability per unit time that a nuclear transformation will occur for a given radionuclide. The decay constant has units of inverse seconds (s–1). It is related to the half-life t½ of a radionuclide by:
![]()
The decay constant l is related to the mean lifetime, t, of a radionuclide by:
![]()
The time dependence of activity A(t) and of the number of radioactive nuclei N(t) can be expressed by ![]() and
and ![]() respectively.
respectively.
Deterministic biological effect. This is a biological effect caused by ionizing radiation and whose probability of occurrence is zero at small absorbed doses but will increase steeply to unity (100%) above some level of absorbed dose (the threshold). Cataract induction is an example of a stochastic biological effect.
Effective dose. The effective dose E is the sum of the weighted equivalent doses in all the tissues and organs of the body. It is a radiation safety quantity, so its use is not appropriate for large absorbed doses delivered in a relatively short period of time. It is given by:
![]()
where w T is the tissue weighting factor and HT is the equivalent dose for tissue T. Effective dose has units of J kg–1. The special name for the unit of effective dose is the sievert (Sv).
Equivalent dose. The equivalent dose HT is the absorbed dose averaged over a tissue or organ (rather than at a point) and weighted for the radiation quality that is of interest. It is a radiation safety quantity, so its use is not appropriate for large absorbed doses delivered in a relatively short period of time. The equivalent dose is given by:
![]()
where DT,R is the absorbed dose averaged over the tissue or organ T due to radiation R and w R
is the radiation weighting factor. Equivalent dose has units of J kg–1. The special name for the unit of equivalent dose is the sievert (Sv).
Half-life. This quantity is the amount of time required for the activity of a radionuclide sample to reduce by a factor of one-half. Equivalently, it is the amount of time required for a given number of nuclei in a given radioactive state to reduce by a factor of one-half. It has fundamental units of seconds (s), but is also commonly expressed in hours, days and years. For a given radionuclide, half-life t½ is related to the decay constant l by:
![]()
Linear energy transfer. This quantity is the energy a charged particle imparts to matter per unit length as it traverses the matter. Formally,
![]()
where L is the linear energy transfer (also called linear collision stopping power) and de is the mean energy lost by the particle in traversing a distance dl. Linear energy transfer (LET) has units of J m–1.
Mean lifetime. This quantity is the average time a nuclear state will survive before it undergoes a transformation to a lower energy state by emitting ionizing radiation. It has fundamental units of seconds (s), but may also be expressed in hours, days or years. It is related to the decay constant by:
![]()
where t is the mean lifetime and l is the decay constant for a given nuclide in a given energy state.
Radiation weighting factor. This is a number w R that, for a given type and energy of radiation R, is representative of values of the relative biological effectiveness of that radiation in inducing stochastic effects at low doses. The values of w R are related to linear energy transfer (LET) and are given in table 1. Figure 2 (overleaf) shows the relationship between w R and LET for neutrons.
Table 1. Radiation weighting factors wR
|
Type and energy range |
wR 1 |
|
Photons, all energies |
1 |
|
Electrons and muons, all energies2 |
1 |
|
Neutrons, energy 10 keV |
5 |
|
10 keV to 100 keV |
10 |
|
>100 keV to 2 MeV |
20 |
|
>2 MeV to 20 MeV |
10 |
|
>20 MeV |
5 |
|
Protons, other than recoil protons, energy >2 MeV |
5 |
|
Alpha particles, fission fragments, heavy nuclei |
20 |
1 All values relate to the radiation incident on the body or, for internal sources, emitted from the source.
2 Excluding Auger electrons emitted from nuclei bound to DNA.
Relative biological effectiveness (RBE). The RBE of one type of radiation compared with another is the inverse ratio of the absorbed doses producing the same degree of a defined biological end point.
Figure 2. Radiation weighting factors for neutrons (the smooth curve is to be treated as an approximation)
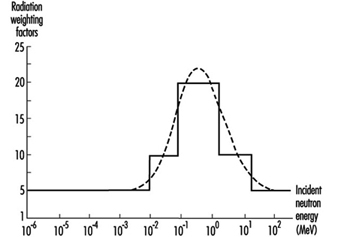
Stochastic biological effect. This is a biological effect caused by ionizing radiation whose probability of occurrence increases with increasing absorbed dose, probably with no threshold, but whose severity is independent of absorbed dose. Cancer is an example of a stochastic biological effect.
Tissue weighting factor w T. This represents the contribution of tissue or organ T to the total detriment due to all of the stochastic effects resulting from uniform irradiation of the whole body. It is used because the probability of stochastic effects due to an equivalent dose depends on the tissue or organ irradiated. A uniform equivalent dose over the whole body should give an effective dose numerically equal to the sum of effective doses for all tissues and organs of the body. Therefore, the sum of all tissue weighting factors is normalized to unity. Table 2 gives values for tissue weighting factors.
Table 2. Tissue weighting factors wT
|
Tissue or organ |
wT 1 |
|
Gonads |
0.20 |
|
Bone marrow (red) |
0.12 |
|
Colon |
0.12 |
|
Lung |
0.12 |
|
Stomach |
0.12 |
|
Bladder |
0.05 |
|
Breast |
0.05 |
|
Liver |
0.05 |
|
Oesophagus |
0.05 |
|
Thyroid |
0.05 |
|
Skin |
0.01 |
|
Bone surface |
0.01 |
|
Remainder |
0.052, 3 |
1 The values have been developed from a reference population of equal numbers of both sexes and a wide range of ages. In the definition of effective dose they apply to workers, to the whole population, and to either sex.
2 For purposes of calculation, the remainder is composed of the following additional tissues and organs: adrenals, brain, upper large intestine, small intestine, kidneys, muscle, pancreas, spleen, thymus and uterus. The list includes organs that are likely to be selectively irradiated. Some organs in the list are known to be susceptible to cancer induction.
3 In those exceptional cases in which a single one of the remainder tissues or organs receives an equivalent dose in excess of the highest dose in any of the twelve organs for which a weighting factor is specified, a weighting factor of 0.025 should be applied to that tissue or organ and a weighting factor of 0.025 to the average dose in the rest of the remainder as defined above.
Radiation Biology and Biological Effects
After its discovery by Roentgen in 1895, the x ray was introduced so rapidly into the diagnosis and treatment of disease that injuries from excessive radiation exposure began to be encountered almost immediately in pioneer radiation workers, who had yet to become aware of the dangers (Brown 1933). The first such injuries were predominantly skin reactions on the hands of those working with the early radiation equipment, but within a decade many other types of injury also had been reported, including the first cancers attributed to radiation (Stone 1959).
Throughout the century since these early findings, study of the biological effects of ionizing radiation has received continuing impetus from the growing uses of radiation in medicine, science and industry, as well as from the peaceful and military applications of atomic energy. As a result, the biological effects of radiation have been investigated more thoroughly than those of virtually any other environmental agent. The evolving knowledge of radiation effects has been influential in shaping measures for the protection of human health against many other environmental hazards as well as radiation.
Nature and Mechanisms of the Biological Effects of Radiation
Energy deposition. In contrast to other forms of radiation, ionizing radiation is capable of depositing enough localized energy to dislodge electrons from the atoms with which it interacts. Thus, as radiation collides randomly with atoms and molecules in passing through living cells, it gives rise to ions and free radicals which break chemical bonds and cause other molecular changes that injure the affected cells. The spatial distribution of the ionizing events depends on the radiation weighting factor, w R of the radiation (see table 1 and figure 1).
Table 1. Radiation weighting factors wR
|
Type and energy range |
wR 1 |
|
Photons, all energies |
1 |
|
Electrons and muons, all energies2 |
1 |
|
Neutrons, energy <10 keV |
5 |
|
10 keV to 100 keV |
10 |
|
>100 keV to 2 MeV |
20 |
|
>2 MeV to 20 MeV |
10 |
|
>20 MeV |
5 |
|
Protons, other than recoil protons, energy >2 MeV |
5 |
|
Alpha particles, fission fragments, heavy nuclei |
20 |
1 All values relate to the radiation incident on the body or, for internal sources, emitted from the source.
2 Excluding Auger electrons emitted from nuclei bound to DNA.
Figure 1. Differences among various types of ionizing radiation in penetrating power in tissue
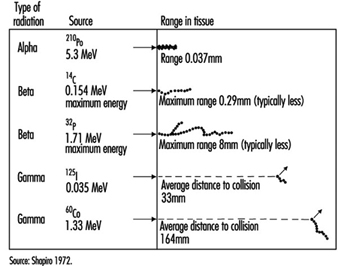
Effects on DNA. Any molecule in the cell may be altered by radiation, but DNA is the most critical biological target because of the limited redundancy of the genetic information it contains. An absorbed dose of radiation large enough to kill the average dividing cell—2 gray (Gy)—suffices to cause hundreds of lesions in its DNA molecules (Ward 1988). Most such lesions are reparable, but those produced by a densely ionizing radiation (for example, a proton or an alpha particle) are generally less reparable than those produced by a sparsely ionizing radiation (for example, an x ray or a gamma ray) (Goodhead 1988). Densely ionizing (high LET) radiations, therefore, typically have a higher relative biological effectiveness (RBE) than sparsely ionizing (low LET) radiations for most forms of injury (ICRP 1991).
Effects on genes. Damage to DNA that remains unrepaired or is misrepaired may be expressed in the form of mutations, the frequency of which appears to increase as a linear, non-threshold function of the dose, approximately 10–5 to 10–6 per locus per Gy (NAS 1990). The fact that the mutation rate appears to be proportional to the dose is interpreted to signify that traversal of the DNA by a single ionizing particle may, in principle, suffice to cause a mutation (NAS 1990). In Chernobyl accident victims, the dose-response relationship for glycophorin mutations in bone marrow cells closely resembles that observed in atomic bomb survivors (Jensen, Langlois and Bigbee 1995).
Effects on chromosomes. Radiation damage to the genetic apparatus may also cause changes in chromosome number and structure, the frequency of which has been observed to increase with the dose in radiation workers, atomic bomb survivors, and others exposed to ionizing radiation. The dose-response relationship for chromosome aberrations in human blood lymphocytes (figure 2) has been characterized well enough so that the frequency of aberrations in such cells can serve as a useful biological dosimeter (IAEA 1986).
Figure 2. Frequency of dicentric chromosome aberrations in human lymphocytes in relation to dose, dose rate, and quality of irradiation in vitro

Effects on cell survival. Among the earliest reactions to irradiation is the inhibition of cell division, which appears promptly after exposure, varying both in degree and duration with the dose (figure 3). Although the inhibition of mitosis is characteristically transitory, radiation damage to genes and chromosomes may be lethal to dividing cells, which are highly radiosensitive as a class (ICRP 1984). Measured in terms of proliferative capacity, the survival of dividing cells tends to decrease exponentially with increasing dose, 1 to 2 Gy generally sufficing to reduce the surviving population by about 50% (figure 4).
Figure 3. Mitotic inhibition induced by x rays in rat corneal epithelial cells
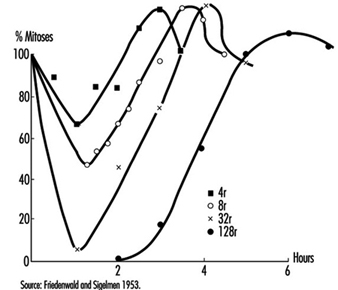
Figure 4. Typical dose-survival curves for mammalian cells exposed to x rays and fast neutrons
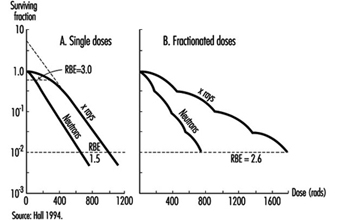
Effects on tissues. Mature, non-dividing cells are relatively radioresistant, but the dividing cells in a tissue are radiosensitive and may be killed in sufficient numbers by intensive irradiation to cause the tissue to become atrophic (figure 5). The rapidity of such atrophy depends on cell population dynamics within the affected tissue; that is, in organs characterized by slow cell turnover, such as the liver and vascular endothelium, the process is typically much slower than in organs characterized by rapid cell turnover, such as the bone marrow, epidermis and intestinal mucosa (ICRP 1984). It is noteworthy, moreover, that if the volume of tissue irradiated is sufficiently small, or if the dose is accumulated gradually enough, the severity of injury may be greatly reduced by the compensatory proliferation of surviving cells.
Figure 5. Characteristic sequence of events in the pathogenesis of nonstochastic effects of ionizing radiation
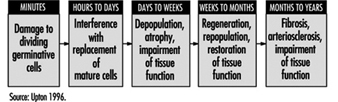
Clinical Manifestations of Injury
Types of effects. Radiation effects encompass a wide variety of reactions, varying markedly in their dose-response relationships, clinical manifestations, timing and prognosis (Mettler and Upton 1995). The effects are often subdivided, for convenience, into two broad categories: (1) heritable effects, which are expressed in the descendants of exposed individuals, and (2) somatic effects, which are expressed in exposed individuals themselves. The latter include acute effects, which occur relatively soon after irradiation, as well as late (or chronic) effects, such as cancer, which may not appear until months, years or decades later.
Acute effects. The acute effects of radiation result predominantly from the depletion of progenitor cells in affected tissues (figure 5) and can be elicited only by doses that are large enough to kill many such cells (for example, table 2). For this reason, such effects are viewed as nonstochastic, or deterministic, in nature (ICRP 1984 and 1991), in contradistinction to the mutagenic and carcinogenic effects of radiation, which are viewed as stochastic phenomena resulting from random molecular alterations in individual cells that increase as linear-nonthreshold functions of the dose (NAS 1990; ICRP 1991).
Table 2. Approximate threshold doses of conventionally fractionated therapeutic x-radiation for clinically detrimental nonstochastic effects in various tissues
|
Organ |
Injury at 5 years |
Threshold |
Irradiation |
|
Skin |
Ulcer, severe fibrosis |
55 |
100 cm2 |
|
Oral mucosa |
Ulcer, severe fibrosis |
60 |
50 cm2 |
|
Oesophagus |
Ulcer, stricture |
60 |
75 cm2 |
|
Stomach |
Ulcer, perforation |
45 |
100 cm2 |
|
Small intestine |
Ulcer, stricture |
45 |
100 cm2 |
|
Colon |
Ulcer, stricture |
45 |
100 cm2 |
|
Rectum |
Ulcer, stricture |
55 |
100 cm2 |
|
Salivary glands |
Xerostomia |
50 |
50 cm2 |
|
Liver |
Liver failure, ascites |
35 |
whole |
|
Kidney |
Nephrosclerosis |
23 |
whole |
|
Urinary bladder |
Ulcer, contracture |
60 |
whole |
|
Testes |
Permanent sterility |
5-15 |
whole |
|
Ovary |
Permanent sterility |
2-3 |
whole |
|
Uterus |
Necrosis, perforation |
>100 |
whole |
|
Vagina |
Ulcer, fistula |
90 |
5 cm2 |
|
Breast, child |
Hypoplasia |
10 |
5 cm2 |
|
Breast, adult |
Atrophy, necrosis |
>50 |
whole |
|
Lung |
Pneumonitis, fibrosis |
40 |
lobe |
|
Capillaries |
Telangiectasis, fibrosis |
50-60 |
s |
|
Heart |
Pericarditis, pancarditis |
40 |
whole |
|
Bone, child |
Arrested growth |
20 |
10 cm2 |
|
Bone, adult |
Necrosis, fracture |
60 |
10 cm2 |
|
Cartilage, child |
Arrested growth |
10 |
whole |
|
Cartilage, adult |
Necrosis |
60 |
whole |
|
Central nervous system (brain) |
Necrosis |
50 |
whole |
|
Spinal cord |
Necrosis, transection |
50 |
5 cm2 |
|
Eye |
Panophthalmitis, haemorrhage |
55 |
whole |
|
Cornea |
Keratitis |
50 |
whole |
|
Lens |
Cataract |
5 |
whole |
|
Ear (inner) |
Deafness |
>60 |
whole |
|
Thyroid |
Hypothyroidism |
45 |
whole |
|
Adrenal |
Hypoadrenalism |
>60 |
whole |
|
Pituitary |
Hypopituitarism |
45 |
whole |
|
Muscle, child |
Hypoplasia |
20-30 |
whole |
|
Muscle, adult |
Atrophy |
>100 |
whole |
|
Bone marrow |
Hypoplasia |
2 |
whole |
|
Bone marrow |
Hypoplasia, fibrosis |
20 |
localized |
|
Lymph nodes |
Atrophy |
33-45 |
s |
|
Lymphatics |
Sclerosis |
50 |
s |
|
Foetus |
Death |
2 |
whole |
* Dose causing effect in 1-5 per cent of exposed persons.
Source: Rubin and Casarett 1972.
Acute injuries of the types that were prevalent in pioneer radiation workers and early radiotherapy patients have been largely eliminated by improvements in safety precautions and treatment methods. Nevertheless, most patients treated with radiation today still experience some injury of the normal tissue that is irradiated. In addition, serious radiation accidents continue to occur. For example, some 285 nuclear reactor accidents (excluding the Chernobyl accident) were reported in various countries between 1945 and 1987, irradiating more than 1,350 persons, 33 of them fatally (Lushbaugh, Fry and Ricks 1987). The Chernobyl accident alone released enough radioactive material to require the evacuation of tens of thousands of people and farm animals from the surrounding area, and it caused radiation sickness and burns in more than 200 emergency personnel and fire-fighters, injuring 31 fatally (UNSCEAR 1988). The long-term health effects of the radioactive material released cannot be predicted with certainty, but estimates of the resulting risks of carcinogenic effects, based on nonthreshold dose-incidence models (discussed below), imply that up to 30,000 additional cancer deaths may occur in the population of the northern hemisphere during the next 70 years as a result of the accident, although the additional cancers in any given country are likely to be too few to be detectable epidemiologically (USDOE 1987).
Less catastrophic, but far more numerous, than reactor accidents have been accidents involving medical and industrial gamma ray sources, which also have caused injuries and loss of life. For example, the improper disposal of a caesium-137 radiotherapy source in Goiânia, Brazil, in 1987, resulted in the irradiation of dozens of unsuspecting victims, four of them fatally (UNSCEAR 1993).
A comprehensive discussion of radiation injuries is beyond the scope of this review, but acute reactions of the more radiosensitive tissues are of widespread interest and are, therefore, described briefly in the following sections.
Skin. Cells in the germinal layer of the epidermis are highly radiosensitive. As a result, rapid exposure of the skin to a dose of 6 Sv or more causes erythema (reddening) in the exposed area, which appears within a day or so, typically lasts a few hours, and is followed two to four weeks later by one or more waves of deeper and more prolonged erythema, as well as by epilation (hair loss). If the dose exceeds 10 to 20 Sv, blistering, necrosis and ulceration may ensue within two to four weeks, followed by fibrosis of the underlying dermis and vasculature, which may lead to atrophy and a second wave of ulceration months or years later (ICRP 1984).
Bone marrow and lymphoid tissue. Lymphocytes also are highly radiosensitive; a dose of 2 to 3 Sv delivered rapidly to the whole body can kill enough of them to depress the peripheral lymphocyte count and impair the immune response within hours (UNSCEAR 1988). Haemopoietic cells in the bone marrow are similarly radiosensitive and are depleted sufficiently by a comparable dose to cause granulocytopenia and thrombocytopenia to ensue within three to five weeks. Such reductions in granulocyte and platelet counts may be severe enough after a larger dose to result in haemorrhage or fatal infection (table 3).
Table 3. Major forms and features of the acute radiation syndrome
|
Time after |
Cerebral form |
Gastro- |
Hemopoietic form |
Pulmonary form |
|
First day |
nausea |
nausea |
nausea |
nausea |
|
Second week |
nausea |
|||
|
Third to sixth |
weakness |
|||
|
Second to eighth |
cough |
Source: UNSCEAR 1988.
Intestine. Stem cells in the epithelium lining the small bowel also are extremely radiosensitive, acute exposure to 10 Sv depleting their numbers sufficiently to cause the overlying intestinal villi to become denuded within days (ICRP 1984; UNSCEAR 1988). Denudation of a large area of the mucosa can result in a fulminating, rapidly fatal dysentery-like syndrome (table 3).
Gonads. Mature spermatozoa can survive large doses (100 Sv), but spermatogonia are so radiosensitive that as little as 0.15 Sv delivered rapidly to both testes suffices to cause oligospermia, and a dose of 2 to 4 Sv can cause permanent sterility. Oocytes, likewise, are radiosensitive, a dose of 1.5 to 2.0 Sv delivered rapidly to both ovaries causing temporary sterility, and a larger dose, permanent sterility, depending on the age of the woman at the time of exposure (ICRP 1984).
Respiratory tract. The lung is not highly radiosensitive, but rapid exposure to a dose of 6 to 10 Sv can cause acute pneumonitis to develop in the exposed area within one to three months. If a large volume of lung tissue is affected, the process may result in respiratory failure within weeks, or may lead to pulmonary fibrosis and cor pulmonale months or years later (ICRP 1984; UNSCEAR 1988).
Lens of the eye. Cells of the anterior epithelium of the lens, which continue to divide throughout life, are relatively radiosensitive. As a result, rapid exposure of the lens to a dose exceeding 1 Sv may lead within months to the formation of a microscopic posterior polar opacity; and 2 to 3 Sv received in a single brief exposure—or 5.5 to 14 Sv accumulated over a period of months—may produce a vision-impairing cataract (ICRP 1984).
Other tissues. In comparison with the tissues mentioned above, other tissues of the body are generally appreciably less radiosensitive (for example, table 2); however, the embryo constitutes a notable exception, as discussed below. Noteworthy also is the fact that the radiosensitivity of every tissue is increased when it is in a rapidly growing state (ICRP 1984).
Whole-body radiation injury. Rapid exposure of a major part of the body to a dose in excess of 1 Gy can cause the acute radiation syndrome. This syndrome includes: (1) an initial prodromal stage, characterized by malaise, anorexia, nausea and vomiting, (2) an ensuing latent period, (3) a second (main) phase of illness and (4) ultimately, either recovery or death (table 3). The main phase of the illness typically takes one of the following forms, depending on the predominant locus of radiation injury: (1) haematological, (2) gastro-intestinal, (3) cerebral or (4) pulmonary (table 3).
Localized radiation injury. Unlike the clinical manifestations of acute whole-body radiation injury, which typically are dramatic and prompt, the reaction to sharply localized irradiation, whether from an external radiation source or from an internally deposited radionuclide, tends to evolve slowly and to produce few symptoms or signs unless the volume of tissue irradiated and/or the dose are relatively large (for example, table 3).
Effects of radionuclides. Some radionuclides - for example, tritium (3H), carbon-14 (14C) and cesium-137 (137Cs) - tend to be distributed systemically and to irradiate the body as a whole, whereas other radionuclides are characteristically taken up and concentrated in specific organs, producing injuries that are correspondingly localized. Radium (Ra) and strontium-90
(90Sr), for example, are deposited predominantly in bone and thus injure skeletal tissues primarily, whereas radioactive iodine concentrates in the thyroid gland, the primary site of any resulting injury (Stannard 1988; Mettler and Upton 1995).
Carcinogenic Effects
General features. The carcinogenicity of ionizing radiation, first manifested early in this century by the occurrence of skin cancers and leukaemias in pioneer radiation workers (Upton 1986), has since been documented extensively by dose-dependent excesses of many types of neoplasms in radium-dial painters, underground hardrock miners, atomic bomb survivors, radiotherapy patients and experimentally irradiated laboratory animals (Upton 1986; NAS 1990).
The benign and malignant growths induced by irradiation characteristically take years or decades to appear and exhibit no known features by which they can be distinguished from those produced by other causes. With few exceptions, moreover, their induction has been detectable only after relatively large dose equivalents (0.5 Sv), and it has varied with the type of neoplasm as well as the age and sex of those exposed (NAS 1990).
Mechanisms. The molecular mechanisms of radiation carcinogenesis remain to be elucidated in detail, but in laboratory animals and cultured cells the carcinogenic effects of radiation have been observed to include initiating effects, promoting effects, and effects on the progression of neoplasia, depending on the experimental conditions in question (NAS 1990). The effects also appear to involve the activation of oncogenes and/or the inactivation or loss of tumor-suppressor genes in many, if not all, instances. In addition, the carcinogenic effects of radiation resemble those of chemical carcinogens in being similarly modifiable by hormones, nutritional variables and other modifying factors (NAS 1990). It is noteworthy, moreover, that the effects of radiation may be additive, synergistic or mutually antagonistic with those of chemical carcinogens, depending on the specific chemicals and exposure conditions in question (UNSCEAR 1982 and 1986).
Dose-effect relationship. Existing data do not suffice to describe the dose-incidence relationship unambiguously for any type of neoplasm or to define how long after irradiation the risk of the growth may remain elevated in an exposed population. Any risks attributable to low-level irradiation can, therefore, be estimated only by extrapolation, based on models incorporating assumptions about such parameters (NAS 1990). Of various dose-effect models that have been used to estimate the risks of low-level irradiation, the one that has been judged to provide the best fit to the available data is of the form:
![]()
where R0 denotes the age-specific background risk of death from a specific type of cancer, D the radiation dose, f(D) a function of dose that is linear-quadratic for leukaemia and linear for some other types of cancer, and g(b) is a risk function dependent on other parameters, such as sex, age at exposure and time after exposure (NAS 1990).
Non-threshold models of this type have been applied to epidemiological data from the Japanese atomic-bomb survivors and other irradiated populations to derive estimates of the lifetime risks of different forms of radiation-induced cancer (for example, table 4). Such estimates must be interpreted with caution, however, in attempting to predict the risks of cancer attributable to small doses or doses that are accumulated over weeks, months or years, since experiments with laboratory animals have shown the carcinogenic potency of x rays and gamma rays to be reduced by as much as an order of magnitude when the exposure is greatly prolonged. In fact, as has been emphasized elsewhere (NAS 1990), the available data do not exclude the possibility that there may be a threshold in the millisievert (mSv) dose equivalent range, below which radiation may lack carcinogenicity.
Table 4. Estimated lifetime risks of cancer attributable to 0.1 Sv rapid irradiation
|
Type or site of cancer |
Excess cancer deaths per 100,000 |
|
|
(No.) |
(%)* |
|
|
Stomach |
110 |
18 |
|
Lung |
85 |
3 |
|
Colon |
85 |
5 |
|
Leukaemia (excluding CLL) |
50 |
10 |
|
Urinary bladder |
30 |
5 |
|
Oesophagus |
30 |
10 |
|
Breast |
20 |
1 |
|
Liver |
15 |
8 |
|
Gonads |
10 |
2 |
|
Thyroid |
8 |
8 |
|
Osteosarcoma |
5 |
5 |
|
Skin |
2 |
2 |
|
Remainder |
50 |
1 |
|
Total |
500 |
2 |
* Percentage increase in “background” expectation for a non-irradiated population.
Source: ICRP 1991.
It is also noteworthy that the estimates tabulated are based on population averages and are not necessarily applicable to any given individual; that is, susceptibility to certain types of cancer (for example, cancers of the thyroid and breast) is substantially higher in children than in adults, and susceptibility to certain cancers is also increased in association with some hereditary disorders, such as retinoblastoma and the nevoid basal cell carcinoma syndrome (UNSCEAR 1988, 1994; NAS 1990). Such differences in susceptibility notwithstanding, population-based estimates have been proposed for use in compensation cases as a basis for gauging the probability that a cancer arising in a previously irradiated person may have been caused by the exposure in question (NIH 1985).
Low-dose risk assessment. Epidemiological studies to ascertain whether the risks of cancer from low-level exposure to radiation actually vary with dose in the manner predicted by the above estimates have been inconclusive thus far. Populations residing in areas of elevated natural background radiation levels manifest no definitely attributable increases in cancer rates (NAS 1990; UNSCEAR 1994); conversely, a few studies have even suggested an inverse relationship between background radiation levels and cancer rates, which has been interpreted by some observers as evidence for the existence of beneficial (or hormetic) effects of low-level irradiation, in keeping with the adaptive responses of certain cellular systems (UNSCEAR 1994). The inverse relationship is of questionable significance, however, since it has not persisted after controlling for the effects of confounding variables (NAS 1990). Likewise in today’s radiation workers—except for certain cohorts of underground hardrock miners (NAS 1994; Lubin, Boice and Edling 1994)—the rates of cancers other than leukaemia are no longer detectably increased (UNSCEAR 1994), thanks to advances in radiation protection; furthermore, the rates of leukaemia in such workers are consistent with the estimates tabulated above (IARC 1994). In summary, therefore, the data available at present are consistent with the estimates tabulated above (table 4), which imply that less than 3% of cancers in the general population are attributable to natural background radiation (NAS 1990; IARC 1994), although up to 10% of lung cancers may be attributable to indoor radon (NAS 1990; Lubin, Boice and Edling 1994).
High levels of radioactive fallout from a thermonuclear weapons test at Bikini in 1954 have been observed to cause a dose-dependent increase in the frequency of thyroid cancer in Marshall Islanders who received large doses to the thyroid gland in childhood (Robbins and Adams 1989). Similarly, children living in areas of Belarus and the Ukraine contaminated by radionuclides released from the Chernobyl accident have been reported to show an increased incidence of thyroid cancer (Prisyazhuik, Pjatak and Buzanov 1991; Kasakov, Demidchik and Astakhova 1992), but the findings are at variance with those of the International Chernobyl Project, which found no excess of benign or malignant thyroid nodules in children living in the more heavily contaminated areas around Chernobyl (Mettler, Williamson and Royal 1992). The basis for the discrepancy, and whether the reported excesses may have resulted from heightened surveillance alone, remain to be determined. In this connection, it is noteworthy that children of south-western Utah and Nevada who were exposed to fallout from nuclear weapons tests in Nevada during the 1950s have shown increase in the frequency of any type of thyroid cancer (Kerber et al. 1993), and the prevalence of acute leukaemia appears to have been elevated in such children dying between 1952 and 1957, the period of greatest exposure to fallout (Stevens et al. 1990).
The possibility that excesses of leukaemia among children residing in the vicinity of nuclear plants in the United Kingdom may have been caused by radioactivity released from the plants has also been suggested. The releases, however, are estimated to have increased the total radiation dose to such children by less than 2%, from which it is inferred that other explanations are more likely (Doll, Evans and Darby 1994). An ineffective aetiology for the observed clusters of leukaemia is implied by the existence of comparable excesses of childhood leukaemia at sites in the UK that lack nuclear facilities but otherwise resemble nuclear sites in having similarly experienced large influxes of population in recent times (Kinlen 1988; Doll, Evans and Darby 1994). Another hypothesis—namely, that the leukaemias in question may have been caused by occupational irradiation of the fathers of the affected children—also has been suggested by the results of a case-control study (Gardner et al. 1990), but this hypothesis is generally discounted for reasons that are discussed in the section to follow.
Heritable Effects
Heritable effects of irradiation, although well documented in other organisms, have yet to be observed in humans. For example, intensive study of more than 76,000 children of the Japanese atomic-bomb survivors, carried out over four decades, has failed to disclose any heritable effects of radiation in this population, as measured by untoward pregnancy outcomes, neonatal deaths, malignancies, balanced chromosomal rearrangements, sex-chromosome aneuploidy, alterations of serum or erythrocyte protein phenotypes, changes in sex ratio or disturbances in growth and development (Neel, Schull and Awa 1990). Consequently, estimates of the risks of heritable effects of radiation must rely heavily on extrapolation from findings in the laboratory mouse and other experimental animals (NAS 1990; UNSCEAR 1993).
From the available experimental and epidemiological data, it is inferred that the dose required to double the rate of heritable mutations in human germ cells must be at least 1.0 Sv (NAS 1990; UNSCEAR 1993). On this basis, it is estimated that less than 1% of all genetically determined diseases in the human population can be attributed to natural background irradiation (table 5).
Table 5. Estimated frequencies of heritable disorders attributable to natural background ionizing irradiation
|
Type of disorder |
Natural prevalence |
Contribution from natural background |
|
|
First generation |
Equilibrium |
||
|
Autosomal |
180,000 |
20-100 |
300 |
|
X-linked |
400 |
<1 |
<15 |
|
Recessive |
2,500 |
<1 |
very slow increase |
|
Chromosomal |
4,400 |
<20 |
very slow increase |
|
Congenital |
20,000-30,000 |
30 |
30-300 |
|
Other disorders of complex aetiology: |
|||
|
Heart disease |
600,000 |
not estimated4 |
not estimated4 |
|
Cancer |
300,000 |
not estimated4 |
not estimated4 |
|
Selected others |
300,000 |
not estimated4 |
not estimated4 |
1 Equivalent to » 1 mSv per year, or » 30 mSv per generation (30 years).
2 Values rounded.
3 After hundreds of generations, the addition of unfavorable radiation-induced mutations eventually becomes balanced by their loss from the population, resulting in a genetic "equilibrium".
4 Quantitative risk estimates are lacking because of uncertainty about the mutational component of the disease(s) indicated.
Source: National Research Council 1990.
The hypothesis that the excess of leukaemia and non-Hodgkin’s lymphoma in young people residing in the village of Seascale resulted from heritable oncogenic effects caused by the occupational irradiation of the children’s fathers at the Sellafield nuclear installation has been suggested by the results of a case-control study (Gardner et al. 1990), as noted above. Arguments against this hypothesis, however, are:
- the lack of any comparable excess in larger numbers of children born outside Seascale to fathers who had received similar, or even larger, occupational doses at the same nuclear plant (Wakeford et al. 1994a)
- the lack of similar excesses in French (Hill and LaPlanche 1990), Canadian (McLaughlin et al. 1993) or Scottish (Kinlen, Clarke and Balkwill 1993) children born to fathers with comparable occupational exposures
- the lack of excesses in the children of atomic-bomb survivors (Yoshimoto et al. 1990)
- the lack of excesses in US counties containing nuclear plants (Jablon, Hrubec and Boice 1991)
- the fact that the frequency of radiation-induced mutations implied by the interpretation is far higher than established rates (Wakeford et al. 1994b).
On balance, therefore, the available data fail to support the paternal gonadal irradiation hypothesis (Doll, Evans and Darby 1994; Little, Charles and Wakeford 1995).
Effects of Prenatal Irradiation
Radiosensitivity is relatively high throughout prenatal life, but the effects of a given dose vary markedly, depending on the developmental stage of the embryo or foetus at the time of exposure (UNSCEAR 1986). During the pre-implantation period, the embryo is most susceptible to killing by irradiation, while during critical stages in organogenesis it is susceptible to the induction of malformations and other disturbances of development (table 6). The latter effects are dramatically exemplified by the dose-dependent increase in the frequency of severe mental retardation (figure 6) and the dose-dependent decrease in IQ test scores in atomic-bomb survivors who were exposed between the eighth and fifteenth weeks (and, to a lesser extent, between the sixteenth and twenty-fifth weeks) (UNSCEAR 1986 and 1993).
Table 6. Major developmental abnormalities produced by prenatal irradiation
|
Brain |
||
|
Anencephaly |
Porencephaly |
Microcephaly* |
|
Encephalocoele |
Mongolism* |
Reduced medulla |
|
Cerebral atrophy |
Mental retardation* |
Neuroblastoma |
|
Narrow aqueduct |
Hydrocephalus* |
Dilatation of ventricles* |
|
Spinal cord anomalies* |
Cranial nerve anomalies |
|
|
Eyes |
||
|
Anophthalmia |
Microphthalmia* |
Microcornia* |
|
Coloboma* |
Deformed iris |
Absence of lens |
|
Absence of retina |
Open eyelids |
Strabismus* |
|
Nystagmus* |
Retinoblastoma |
Hypermetropia |
|
Glaucoma |
Cataract* |
Blindness |
|
Chorioretinitis* |
Partial albinism |
Ankyloblepharon |
|
Skeleton |
||
|
General stunting |
Reduced size of skull |
Skull deformities* |
|
Head ossification defects* |
Vaulted cranium |
Narrow head |
|
Cranial blisters |
Cleft palate* |
Funnel chest |
|
Dislocation of hip |
Spina bifida |
Deformed tail |
|
Deformed feet |
Club foot* |
Digital anomalies* |
|
Calcaneo valgus |
Odontogenesis imperfecta* |
Tibial exostosis |
|
Amelanogenesis* |
Scleratomal necrosis |
|
|
Miscellaneous |
||
|
Situs inversus |
Hydronephrosis |
Hydroureter |
|
Hydrocoele |
Absence of kidney |
Gonadal anomalies* |
|
Congenital heart disease |
Facial deformities |
Pituitary disturbances |
|
Deformities of ears |
Motor disturbances |
Dermatomal necrosis |
|
Myotomal necrosis |
Abnormalities in skinpigmentation |
|
* These abnormalities have been observed in humans exposed prenatally to large doses of radiation and have, therefore, been tentatively attributed to irradiation.
Source: Brill and Forgotson 1964.
Susceptibility to the carcinogenic effects of radiation also appears to be relatively high throughout the prenatal period, judging from the association between childhood cancer (including leukaemia) and prenatal exposure to diagnostic x rays reported in case-control studies (NAS 1990). The results of such studies imply that prenatal irradiation may cause a 4,000% per Sv increase in the risk of leukaemia and other childhood cancers (UNSCEAR 1986; NAS 1990), which is a far larger increase than is attributable to postnatal irradiation (UNSCEAR 1988; NAS 1990). Although, paradoxically, no excess of childhood cancer was recorded in A-bomb survivors irradiated prenatally (Yoshimoto et al. 1990), as noted above, there were too few such survivors to exclude an excess of the magnitude in question.
Figure 6. The frequency of severe mental retardation in relation to radiation dose in prenatally irradiated atomic bomb survivors
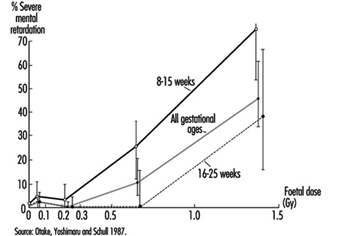
Summary and Conclusions
The adverse effects of ionizing radiation on human health are widely diverse, ranging from rapidly fatal injuries to cancers, birth defects, and hereditary disorders that appear months, years or decades later. The nature, frequency and severity of effects depend on the quality of the radiation in question as well as on the dose and conditions of exposure. Most such effects require relatively high levels of exposure and are, therefore, encountered only in accident victims, radiotherapy patients, or other heavily irradiated persons. The genotoxic and carcinogenic effects of ionizing radiation, by contrast, are presumed to increase in frequency as linear non-threshold functions of the dose; hence, although the existence of thresholds for these effects cannot be excluded, their frequency is assumed to increase with any level of exposure. For most effects of radiation, the sensitivity of exposed cells varies with their rate of proliferation and inversely with their degree of differentiation, the embryo and growing child being especially vulnerable to injury.
Sources of Ionizing Radiation
Ionizing Radiation Types
Alpha particles
An alpha particle is a tightly bound collection of two protons and two neutrons. It is identical to a helium-4 (4He) nucleus. Indeed, its ultimate fate after it loses most of its kinetic energy is to capture two electrons and become a helium atom.
Alpha-emitting radionuclides are generally relatively massive nuclei. Almost all alpha emitters have atomic numbers greater than or equal to that of lead (82Pb). When a nucleus decays by emitting an alpha particle, both its atomic number (number of protons) and its number of neutrons are reduced by two and its atomic mass number is reduced by four. For example, the alpha decay of uranium-238 (238U) to thorium-234 (234Th) is represented by:
![]()
![]()
The left superscript is the atomic mass number (number of protons plus neutrons), the left subscript is the atomic number (number of protons), and the right subscript is the number of neutrons.
Common alpha emitters emit alpha particles with kinetic energies between about 4 and 5.5 MeV. Such alpha particles have a range in air of no more than about 5 cm (see figure 1). Alpha particles with an energy of at least 7.5 MeV are required to penetrate the epidermis (the protective layer of skin, 0.07 mm thick). Alpha emitters generally do not pose an external radiation hazard. They are hazardous only if taken within the body. Because they deposit their energy in a short distance, alpha particles are high linear energy transfer (LET) radiation and have a large radiation weighting factor; typically, w R=20.
Figure 1. Range-energy radiation of slow alpha particles in air at 15 and 760 m
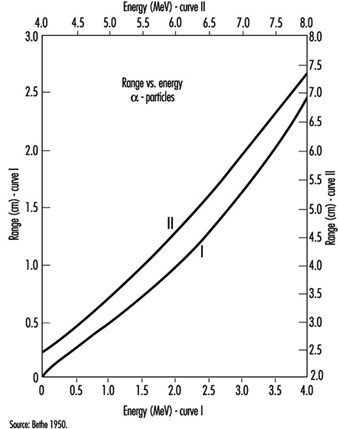
Beta particles
A beta particle is a highly energetic electron or positron. (A positron is the anti-particle of the electron. It has the same mass and most other properties of an electron except for its charge, which is exactly the same magnitude as that of an electron but is positive.) Beta-emitting radionuclides can be of high or low atomic weight.
Radionuclides that have an excess of protons in comparison with stable nuclides of about the same atomic mass number can decay when a proton in the nucleus converts to a neutron. When this occurs, the nucleus emits a positron and an extremely light, very non-interacting particle called a neutrino. (The neutrino and its anti-particle are of no interest in radiation protection.) When it has given up most of its kinetic energy, the positron ultimately collides with an electron and both are annihilated. The annihilation radiation produced is almost always two 0.511 keV (kiloelectron volt) photons travelling in directions 180 degrees apart. A typical positron decay is represented by:
![]()
where the positron is represented by β+ and the neutrino by n. Note that the resulting nuclide has the same atomic mass number as the parent nuclide and an atomic (proton) number larger by one and a neutron number lesser by one than those of the original nuclide.
Electron capture competes with positron decay. In electron capture decay, the nucleus absorbs an orbital electron and emits a neutrino. A typical electron capture decay is given by:
![]()
Electron capture is always possible when the resulting nucleus has a lower total energy than the initial nucleus. However, positron decay requires that the total energy of the initial atom is greater than that of the resulting atom by more than 1.02 MeV (twice the rest mass energy of the positron).
Similar to positron and electron capture decay, negatron (β–) decay occurs for nuclei that have an excess of neutrons compared to stable nuclei of about the same atomic mass number. In this case, the nucleus emits a negatron (energetic electron) and an anti-neutrino. A typical negatron decay is represented by:
![]()
where the negatron is represented by β– and the anti-neutrino by`n Here the resulting nucleus gains one neutron at the expense of one proton but again does not change its atomic mass number.
Alpha decay is a two-body reaction, so alpha particles are emitted with discrete kinetic energies. However, beta decay is a three-body reaction, so beta particles are emitted over a spectrum of energies. The maximum energy in the spectrum depends on the decaying radionuclide. The average beta energy in the spectrum is approximately one-third of the maximum energy (see figure 2).
Figure 2. Energy spectrum of negatrons emitted from 32P
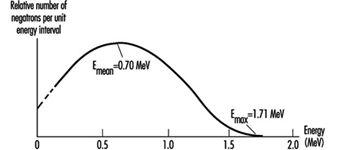
Typical maximum beta energies range from 18.6 keV for tritium (3H) to 1.71 MeV for phosphorus-32 (32P).
The range of beta particles in air is approximately 3.65 m per MeV of kinetic energy. Beta particles of at least 70 keV energy are required to penetrate the epidermis. Beta particles are low-LET radiation.
Gamma radiation
Gamma radiation is electromagnetic radiation emitted by a nucleus when it undergoes a transition from a higher to a lower energy state. The number of protons and neutrons in the nucleus does not change in such a transition. The nucleus may have been left in the higher energy state following an earlier alpha or beta decay. That is, gamma rays are often emitted immediately following alpha or beta decays. Gamma rays can also result from neutron capture and inelastic scattering of subatomic particles by nuclei. The most energetic gamma rays have been observed in cosmic rays.
Figure 3 is a picture of the decay scheme for cobalt-60 (60Co). It shows a cascade of two gamma rays emitted in nickel-60 (60Ni) with energies of 1.17 MeV and 1.33 MeV following the beta decay of 60Co.
Figure 3. Radioactive decay scheme for 60Co

Figure 4 is a picture of the decay scheme for molybdenum-99 (99Mo). Note that the resulting technetium-99 (99Tc) nucleus has an excited state that lasts for an exceptionally long time (t½ = 6 h). Such an excited nucleus is called an isomer. Most excited nuclear states have half-lives between a few picoseconds (ps) and 1 microsecond (μs).
Figure 4. Radioactive decay scheme for 99Mo
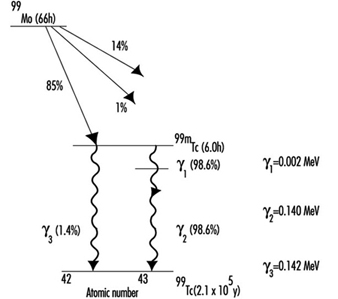
Figure 5 is a picture of the decay scheme for arsenic-74 (74As). It illustrates that some radionuclides decay in more than one way.
Figure 5. Radioactive decay scheme for 74As, illustrating competing processes of negatron emission, positron emission and electron capture (m0 is the rest mass of the electron)
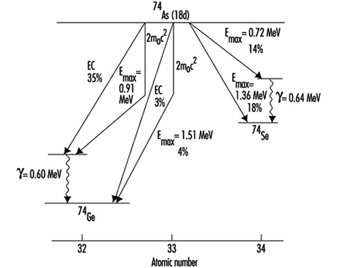
While alpha and beta particles have definite ranges in matter, gamma rays are attenuated exponentially (ignoring build-up that results from scattering within a material) as they pass through matter. When build-up can be ignored the attenuation of gamma rays is given by:
![]()
where I(x) is the gamma ray intensity as a function of distance x into the material and μ is the mass attenuation coefficient. The mass attenuation coefficient depends on gamma-ray energy and on the material with which the gamma rays are interacting. Mass attenuation coefficient values are tabulated in many references. Figure 6 shows the absorption of gamma rays in matter in conditions of good geometry (build-up can be ignored).
Figure 6. Atenuation of 667 keV gamma rays in Al and Pb under conditions of good geometry (dashed line represents attenuation of a poly-energetic photon beam)
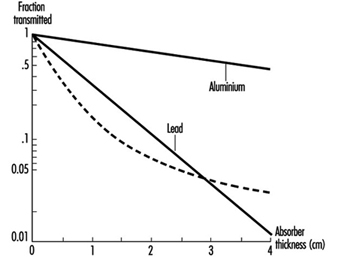
Build-up occurs when a broad gamma-ray beam interacts with matter. The measured intensity at points within the material is increased relative to the expected “good geometry” (narrow beam) value due to gamma rays scattered from the sides of the direct beam into the measuring device. The degree of build-up depends on the geometry of the beam, on the material and on the energy of the gamma rays.
Internal conversion competes with gamma emission when a nucleus transforms from a higher energy state to a lower one. In internal conversion, an inner orbital electron is ejected from the atom instead of the nucleus emitting a gamma ray. The ejected electron is directly ionizing. As outer orbital electrons drop to lower electronic energy levels to fill the vacancy left by the ejected electron, the atom emits x rays. Internal conversion probability relative to gamma emission probability increases with increasing atomic number.
X rays
X rays are electromagnetic radiation and, as such, are identical to gamma rays. The distinction between x rays and gamma rays is their origin. Whereas gamma rays originate in the atomic nucleus, x rays result from electron interactions. Although x rays often have lower energies than gamma rays, this is not a criterion for differentiating them. It is possible to produce x rays with energies much higher than gamma rays resulting from radioactive decay.
Internal conversion, discussed above, is one method of x ray production. In this case, the resulting x rays have discrete energies equal to the difference in the energy levels between which the orbital electrons transit.
Charged particles emit electromagnetic radiation whenever they are accelerated or decelerated. The amount of radiation emitted is inversely proportional to the fourth power of the particle’s mass. As a result, electrons emit much more x radiation than heavier particles such as protons, all other conditions being equal. X-ray systems produce x rays by accelerating electrons across a large electric potential difference of many kV or MV. The electrons are then quickly decelerated in a dense, heat-resistant material, such as tungsten (W).
The x rays emitted from such systems have energies spread over a spectrum ranging from about zero up to the maximum kinetic energy possessed by the electrons before deceleration. Often superimposed on this continuous spectrum are x rays of discrete energy. They are produced when the decelerating electrons ionize the target material. As other orbital electrons move to fill vacancies left after ionization, they emit x rays of discrete energies similar to the way x rays are emitted following internal conversion. They are called characteristic x rays because they are characteristic of the target (anode) material. See figure 7 for a typical x ray spectrum. Figure 8 depicts a typical x ray tube.
Figure 7. X-ray spectrum illustrating the contribution of characteristic x rays produced as electrons fill holes in the K shell of W (the wavelength of x rays is inversely proportional to their energy)
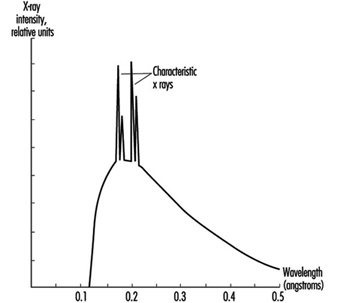
X rays interact with matter the same way gamma rays do, but a simple exponential attenuation equation does not adequately describe the attenuation of x rays with a continuous range of energies (see figure 6). However, as lower energy x rays are removed more rapidly from the beam than higher energy x rays as they pass through material, the description of attenuation approaches an exponential function.
Figure 8. A simplified x-ray tube with a stationary anode and a heated filament

Neutrons
Generally, neutrons are not emitted as a direct result of natural radioactive decay. They are produced during nuclear reactions. Nuclear reactors produce neutrons in the greatest abundance but particle accelerators and special neutron sources, called (α, n) sources, also can yield neutrons.
Nuclear reactors produce neutrons when uranium (U) nuclei in nuclear fuel split, or fission. Indeed, the production of neutrons is essential in maintaining nuclear fission in a reactor.
Particle accelerators produce neutrons by accelerating charged particles, such as protons or electrons, to high energies to bombard stable nuclei in a target. Neutrons are only one of the particles that can result from such nuclear reactions. For example, the following reaction produces neutrons in a cyclotron that is accelerating deuterium ions to bombard a beryllium target:
![]()
Alpha emitters mixed with beryllium are portable sources of neutrons. These (α, n) sources produce neutrons via the reaction:
![]()
The source of the alpha particles can be such isotopes as polonium-210 (210Po),
plutonium-239 (239Pu) and americium-241 (241Am).
Neutrons are generally classified according to their energy as illustrated in table 1. This classification is somewhat arbitrary and may vary in different contexts.
Table 1. Classification of neutrons according to kinetic energy
|
Type |
Energy range |
|
Slow or thermal |
0-0.1 keV |
|
Intermediate |
0.1-20 keV |
|
Fast |
20 keV-10 MeV |
|
High-energy |
>10 MeV |
A number of possible modes of neutron interaction with matter exist, but the two main modes for the purposes of radiation safety are elastic scattering and neutron capture.
Elastic scattering is the means by which higher-energy neutrons are reduced to thermal energies. Higher-energy neutrons interact primarily by elastic scattering and generally do not cause fission or produce radioactive material by neutron capture. It is thermal neutrons that are primarily responsible for the latter types of interaction.
Elastic scattering occurs when a neutron interacts with a nucleus and bounces off with reduced energy. The interacting nucleus takes up the kinetic energy the neutron loses. After being excited in this manner, the nucleus soon gives up this energy as gamma radiation.
When the neutron eventually reaches thermal energies (so-called because the neutron is in thermal equilibrium with its environment), it is easily captured by most nuclei. Neutrons, having no charge, are not repelled by the positively charged nucleus as are protons. When a thermal neutron approaches a nucleus and comes within the range of the strong nuclear force, on the order of a few fm (fm = 10–15 metres), the nucleus captures the neutron. The result can then be a radioactive nucleus that emits a photon or other particle or, in the case of fissionable nuclei such as 235U and 239Pu, the capturing nucleus can fission into two smaller nuclei and more neutrons.
The laws of kinematics indicate that neutrons will reach thermal energies more rapidly if the elastic scattering medium includes a large number of light nuclei. A neutron rebounding off a light nucleus loses a much larger percentage of its kinetic energy than when it bounces off of a heavy nucleus. For this reason, water and hydrogenous materials are the best shielding material to slow down neutrons.
A monoenergetic beam of neutrons will attenuate exponentially in material, obeying an equation similar to that given above for photons. The probability of a neutron interacting with a given nucleus is described in terms of the quantity cross section. Cross section has units of area. The special unit for cross section is the barn (b), defined by:
![]()
It is extremely difficult to produce neutrons without accompanying gamma and x rays. It may be generally assumed that if neutrons are present, so are high energy photons.
Ionizing Radiation Sources
Primordial radionuclides
Primordial radionuclides occur in nature because their half-lives are comparable with the age of the earth. Table 2 lists the most important primordial radionuclides.
Table 2. Primordial radionuclides
|
Radioisotope |
Half-life (109 Y) |
Abundance (%) |
|
238U |
4.47 |
99.3 |
|
232Th |
14.0 |
100 |
|
235U |
0.704 |
0.720 |
|
40K |
1.25 |
0.0117 |
|
87Rb |
48.9 |
27.9 |
Uranium and thorium isotopes head a long chain of progeny radioisotopes that, as a result, are also naturally occurring. Figure 9, A-C, illustrates the decay chains for 232Th, 238U and 235U, respectively. Because alpha decay is common above atomic mass number 205 and an alpha particle’s atomic mass number is 4, there are four distinct decay chains for heavy nuclei. One of these chains (see figure 9, D), that for 237Np, does not occur in nature. This is because it does not contain a primordial radionuclide (that is, no radionuclide in this chain has a half-life comparable with the age of the earth).
Figure 9. Decay series (Z = atomic number; N = atomic mass number)
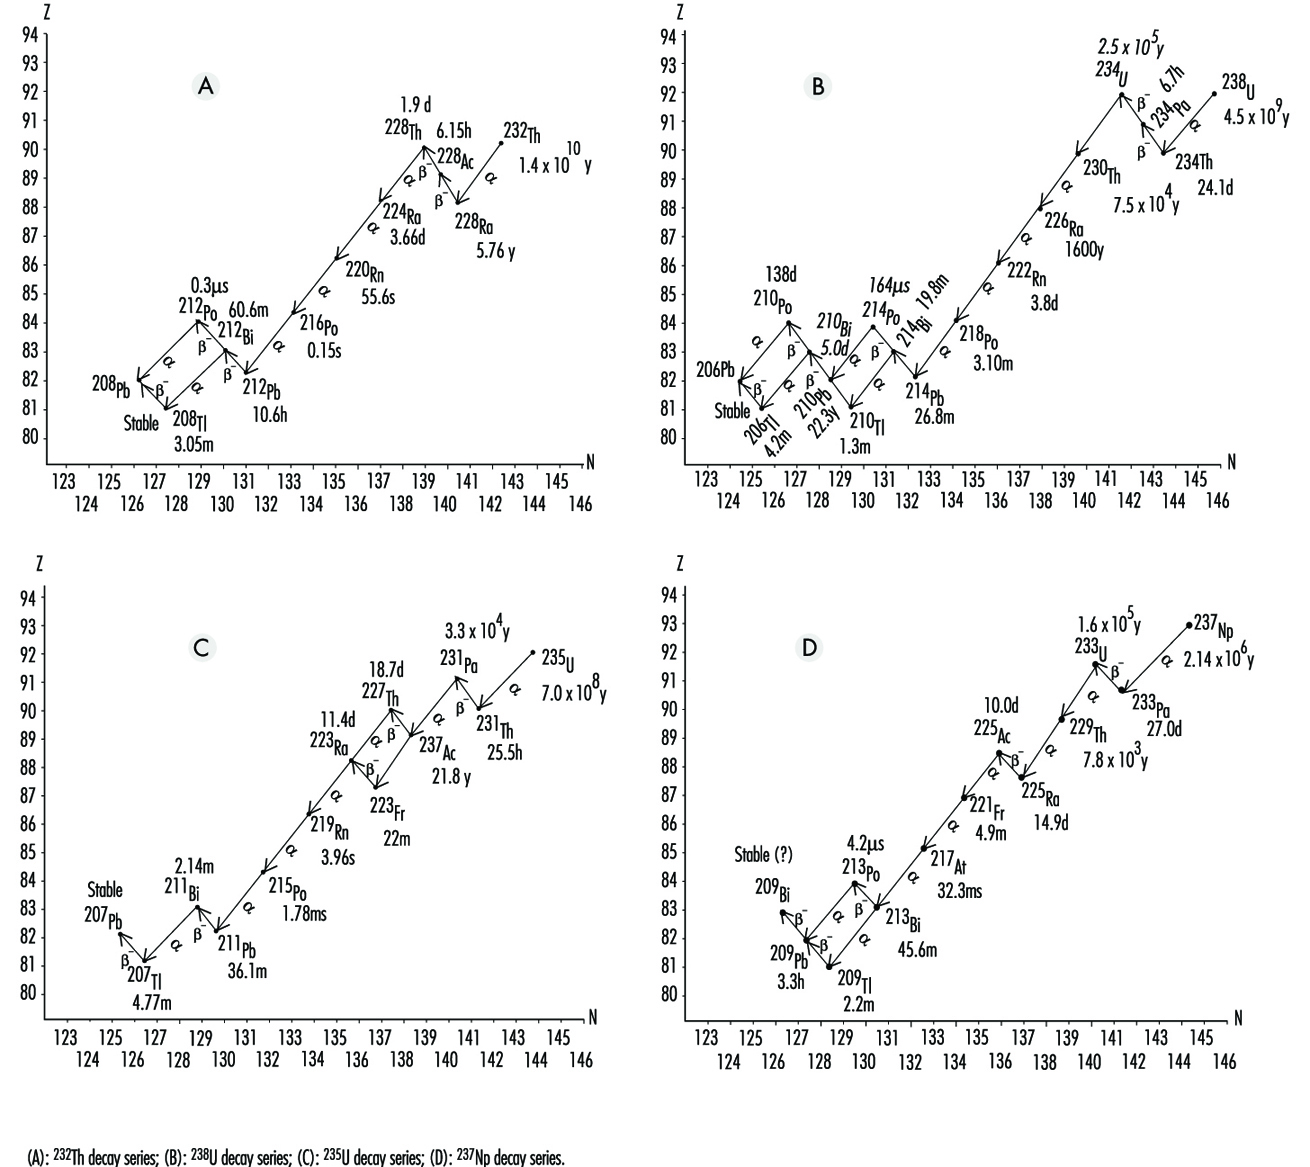 Note that radon (Rn) isotopes occur in each chain (219Rn, 220Rn and 222Rn). Since Rn is a gas, once Rn is produced, it has a chance of escape to the atmosphere from the matrix in which it was formed. However, the half-life of 219Rn is much too short to allow significant amounts of it to reach a breathing zone. The relatively short half-life of 220Rn usually makes it a lesser health hazard concern than 222Rn.
Not including Rn, primordial radionuclides external to the body deliver on the average about 0.3 mSv annual effective dose to the human population. The actual annual effective dose varies widely and is determined primarily by the concentration of uranium and thorium in the local soil. In some parts of the world where monazite sands are common, the annual effective dose to a member of the population is as high as about 20 mSv. In other places such as on coral atolls and near seashores, the value may be as low as 0.03 mSv (see figure 9).
Radon is usually considered separately from other naturally occurring terrestrial radionuclides. It seeps into the air from the soil. Once in the air, Rn further decays to radioactive isotopes of Po, bismuth (Bi) and Pb. These progeny radionuclides attach themselves to dust particles that may be breathed in and trapped in the lungs. Being alpha emitters, they deliver almost all of their radiation energy to the lungs. It is estimated that the average annual lung equivalent dose from such exposure is about 20 mSv. This lung equivalent dose is comparable to a whole body effective dose of about 2 mSv. Clearly, Rn and its progeny radionuclides are the most significant contributors to background radiation effective dose (see figure 9).
Cosmic rays
Cosmic radiation includes energetic particles of extraterrestrial origin that strike the atmosphere of the earth (primarily particles and mostly protons). It also includes secondary particles; mostly photons, neutrons and muons, generated by interactions of primary particles with gases in the atmosphere.
By virtue of these interactions, the atmosphere serves as a shield against cosmic radiation, and the thinner this shield, the greater the effective dose rate. Thus, the cosmic-ray effective dose rate increases with altitude. For example, the dose rate at an altitude of 1,800 metres is about double that at sea level.
Because primary cosmic radiation consists mostly of charged particles, it is influenced by the earth’s magnetic field. People living in higher latitudes receive greater effective doses of cosmic radiation than those closer to the earth’s equator. Variation due to this effect is of the order
of 10%.
Finally, the cosmic-ray effective dose rate varies according to modulation of the sun’s cosmic-ray output. On the average, cosmic rays contribute about 0.3 mSv to background radiation whole-body effective dose.
Cosmogenic radionuclides
Cosmic rays produce cosmogenic radionuclides in the atmosphere. The most prominent of these are tritium (3H), beryllium-7 (7Be), carbon-14 (14C) and sodium-22 (22Na). They are produced by cosmic rays interacting with atmospheric gases. Cosmogenic radionuclides deliver about 0.01 mSv annual effective dose. Most of this comes from 14C.
Nuclear fallout
From the 1940s through the 1960s, extensive testing of nuclear weapons above ground occurred. This testing produced large quantities of radioactive materials and distributed them to the environment throughout the world as fallout. Although much of this debris has since decayed to stable isotopes, small amounts that remain will be a source of exposure for many years to come. In addition, nations that continue to occasionally test nuclear weapons in the atmosphere add to the worldwide inventory.
The primary fallout contributors to effective dose currently are strontium-90 (90Sr) and caesium-137 (137Cs), both of which have half-lives around 30 years. The average annual effective dose from fallout is about 0.05 mSv.
Radioactive material in the body
The deposition of naturally occurring radionuclides in the human body results primarily from the inhalation and ingestion of these materials in air, food and water. Such nuclides include radioisotopes of Pb, Po, Bi, Ra, K (potassium), C, H, U and Th. Of these, 40K is the largest contributor. Naturally occurring radionuclides deposited in the body contribute about 0.3 mSv to the annual effective dose.
Machine-produced radiation
The use of x rays in the healing arts is the largest source of exposure to machine-produced radiation. Millions of medical x ray systems are in use around the world. The average exposure to these medical x ray systems is greatly dependent on a population’s access to care. In developed countries, the average annual effective dose from medically prescribed radiation from x rays and radioactive material for diagnosis and therapy is on the order of 1 mSv.
X rays are a by-product of most high-energy physics particle accelerators, especially those that accelerate electrons and positrons. However, appropriate shielding and safety precautions plus the limited population at risk make this source of radiation exposure less significant than the above sources.
Machine-produced radionuclides
Particle accelerators can produce a large variety of radionuclides in varying quantities by way of nuclear reactions. Accelerated particles include protons, deuterons (2H nuclei), alpha particles, charged mesons, heavy ions and so on. Target materials can be made of almost any isotope.
Particle accelerators are virtually the only source for positron-emitting radioisotopes. (Nuclear reactors tend to produce neutron-rich radioisotopes that decay by negatron emission.) They are also being increasingly used to produce short-lived isotopes for medical use, especially for positron-emission tomography (PET).
Technologically enhanced material and consumer products
X rays and radioactive materials appear, wanted and unwanted, in a great number of modern-day operations. Table 3 lists these radiation sources.
Table 3. Sources and estimates of associated population effective doses from technologically enhanced material and consumer products
|
Group I - Involves large numbers of people and the individual effective dose is very |
|
|
Tobacco products |
Combustible fuels |
|
Domestic water supplies |
Glass and ceramics |
|
Building materials |
Ophthalmic glass |
|
Mining and agricultural products |
|
|
Group II - Involves many people but the effective dose is relatively small or is limited |
|
|
Television receivers |
Highway and road construction materials |
|
Radioluminous products |
Aircraft transport of radioactive materials |
|
Airport inspection systems |
Spark gap irradiators and electron tubes |
|
Gas and aerosol (smoke) detectors |
Thorium products - fluorescent lamp starters |
|
Group III - Involves relatively few people and the collective effective dose is small |
|
|
Thorium products - tungsten welding rods |
|
Source: NCRP 1987.
Workplace Design for Radiation Safety
Basic Design Features of Radiation Facilities
Hazards associated with the handling and use of radiation sources necessitate special features of design and construction that are not required for conventional laboratories or working areas. These special design features are incorporated so that the facility worker is not unduly hampered while ensuring that he or she is not exposed to undue external or internal radiation hazards.
Access to all areas where exposure to radiation sources or radioactive materials could occur must be controlled not only with respect to the facility workers who may be permitted to enter such work areas, but also with respect to the type of clothing or protective equipment that they should wear and the precautions that they should take in controlled areas. In the administration of such control measures, it helps to classify radiation work areas based on the presence of ionizing radiation, on the presence of radioactive contamination or both. The introduction of such work area classification concepts in early planning stages will result in the facility having all the features necessary to make operations with radiation sources less hazardous.
Classification of working areas and laboratory types
The basis for the classification of the work area is the grouping of radionuclides according to their relative radiotoxicities per unit activity. Group I should be classified as very high toxicity radionuclides, Group II as moderate-to-high toxicity radionuclides, Group III as moderate toxicity radionuclides, and Group IV as low toxicity radionuclides. Table 1 shows the toxicity group classification of many radionuclides.
Table 1. Radionuclides classified according to relative radiotoxicity per unit activity
|
Group I: Very high toxicity |
|||||||||
|
210Pb |
210Po |
223Ra |
226Ra |
228Ra |
227Ac |
227Th |
228Th |
230Th |
231Pa |
|
230U |
232U |
233U |
234U |
237Np |
238Pu |
239Pu |
240Pu |
241Pu |
242Pu |
|
241Am |
243Am |
242Cm |
243Cm |
244Cm |
245Cm |
246Cm |
249Cm |
250Cf |
252Cf |
|
Group II: High toxicity |
|||||||||
|
22Na |
36Cl |
45Ca |
46Sc |
54Mn |
56Co |
60Co |
89Sr |
90Sr |
91Y |
|
95Zr |
106Ru |
110Agm |
115Cdm |
114Inm |
124Sb |
125Sb |
127Tem |
129Tem |
124I |
|
126I |
131I |
133I |
134Cs |
137Cs |
140Ba |
144Ce |
152Eu (13 y) |
154Eu |
160Tb |
|
170Tm |
181Hf |
210Bi |
182Ta |
192Ir |
204Tl |
207Bi |
230Pa |
211At |
212Pb |
|
224Ra |
228Ac |
234Th |
236U |
249Bk |
|||||
|
Group III: Moderate toxicity |
|||||||||
|
7Be |
14C |
18F |
24Na |
38Cl |
31Si |
32P |
35S |
41A |
42K |
|
43K |
47Sc |
48Sc |
48V |
51Cr |
52Mn |
56Mn |
52Fe |
55Fe |
59Fe |
|
57Co |
53Ni |
65Ni |
64Cu |
65Zn |
69Znm |
72Ga |
73As |
74As |
76As |
|
77As |
82Br |
85Krm |
87Kr |
86Rb |
85Sr |
91Sr |
90Y |
92Y |
93Y |
|
97Zr |
95Nb |
99Mo |
96Tc |
97Tcm |
97Tc |
99Tc |
97Ru |
103Ru |
105Ru |
|
105Rh |
109Pd |
105Ag |
111Ag |
109Cd |
115Cd |
115Inm |
113Sn |
125Sn |
122Sb |
|
125Tem |
129Te |
131Tem |
132Te |
130I |
132I |
134I |
135I |
135Xe |
131Cs |
|
136Cs |
140La |
141Ce |
143Ce |
142Pr |
143Pr |
147Nd |
149Nd |
147Pm |
149Pm |
|
151Sm |
152Eu (9.2 h) |
155Eu |
153Gd |
159Gd |
165Dy |
166Dy |
166Ho |
169Er |
171Er |
|
171Tm |
177Lu |
181W |
185W |
187W |
183Re |
186Re |
188Re |
185Os |
191Os |
|
193Os |
190Ir |
195Ir |
191Pt |
193Pt |
197Pt |
196Au |
198Au |
199Au |
197Hg |
|
197Hgm |
203Hg |
200Tl |
201Tl |
202Tl |
203Pb |
206Bi |
212Bi |
220Rn |
222Rn |
|
231Th |
233Pa |
239Np |
|||||||
|
Group IV: Low toxicity |
|||||||||
|
3H |
15O |
37A |
58Com |
59Ni |
69Zn |
71Ge |
85Kr |
85Srm |
87Rb |
|
91Ym |
93Zr |
97Nb |
96Tcm |
99Tcm |
103Rhm |
133Inm |
129I |
131Xem |
133Xe |
|
134Csm |
135Cs |
147Sm |
187Re |
191Osm |
193Ptm |
197Ptm |
natTh |
232Th |
235U |
|
238U |
natU |
||||||||
(IAEA 1973)
Three broad types of laboratories can be envisaged on the basis of radiotoxicity considerations, the amounts or quantities of radioactive materials that will be handled in the work area and the type of operations involved.
Table 2 describes laboratories by type and provides examples for each type. Table 3 shows the types of laboratories along with the work area classification and access control (IAEA 1973).
Table 2. Classification of working areas
|
Type |
Definition |
Access control |
Typical operations |
|
1 |
Areas in which the external radiation absorbed dose levels or radioactive contamination levels could be high |
Access controlled to radiation workers only, under strictly controlled working conditions and with appropriate protective equipment |
Hot laboratories, highly contaminated areas |
|
2 |
Areas in which external radiation levels could exist and in which the possibility of contamination necessitates operating instructions |
Access limited to radiation workers with |
Luminizing factories and other equivalent |
|
3 |
Areas in which the average external radiation level is less than 1 mGy·wk-1 and in which the possibility of radioactive contamination necessitates special operating instructions |
Access limited to radiation workers, no |
Working areas in the immediate vicinity of |
|
4 |
Areas within the confines of a radiation facility where the external radiation levels are less than 0.1 mGy•wk-1 and where |
Access uncontrolled |
Administration and patient waiting areas |
(ICRP 1977, IAEA 1973)
Table 3. Classification of laboratories for handling radioactive materials
|
Group of |
Type of laboratory required for the activity specified below |
||
|
Type 1 |
Type 2 |
Type 3 |
|
|
I |
<370 kBq |
70 kBq to |
>37 MBq |
|
II |
<37 MBq |
37 MBq to |
>37 GBq |
|
III |
<37 GBq |
37 GBq to |
>370 GBq |
|
IV |
<370 GBq |
370 GBq to |
>37 Tbq |
|
Operational factors for laboratory use of radioactive material |
Multiplication factors for the activity levels |
|
Simple storage |
×100 |
|
Simple wet operations (for example, preparation of aliquots of stock solution) |
×10 |
|
Normal chemical operations (for example, simple chemical preparation and analysis) |
×1 |
|
Complex wet operations (for example, multiple operations or operations with complex glass ware) |
×0.1 |
|
Simple dry operations (for example, manipulations of powders of volatile radioactive compounds) |
×0.1 |
|
Dry and dusty operations (for example, grinding) |
×0.01 |
(ICRP 1977, IAEA 1973)
The hazards involved in working with radioactive material depend not only on the level of radiotoxicity or chemical toxicity and the activity of the radionuclides, but also on the radioactive material’s physical and chemical form and on the nature and complexity of the operation or procedure being performed.
Location of a radiation facility in a building
When a radiation facility is part of a large building, the following should be kept in mind when deciding on the location of such a facility:
- The radiation facility should be located in a relatively unfrequented part of the building, so that access to the area can be easily controlled.
- The potential for fires should be minimal in the area chosen.
- The location of the radiation facility and the heating and ventilation provided should be such that possibilities for the spread of both surface and airborne radioactive contamination are minimal.
- The location of the radiation facility should be chosen judiciously, so that with a minimum expenditure for shielding, radiation levels can be effectively maintained within established limits in the immediate vicinity.
Planning of radiation facilities
Where a gradation of levels of activity is envisioned, the laboratory should be located so that access to areas where high radiation or radioactive contamination levels exist is gradual; that is, one first enters a non-radiation area, then a low activity area, then a medium activity area and so on.
The need for elaborate control of ventilation in small laboratories can be avoided by the use of hoods or glove boxes for handling unsealed sources of radioactive material. However, the ventilation system should be designed to permit air flow in a direction such that any radioactive material that becomes airborne will flow away from the radiation worker. The air flow should always be from an uncontaminated area toward a contaminated or potentially contaminated area.
For the handling of unsealed sources of low to medium radioactivity, the average air speed through the opening in the hood must be about 0.5 ms–1. For highly radiotoxic or high-level radioactivity, the air velocity through the opening should be raised to an average of 0.6 to
1.0 ms–1. However, excessively high air speeds can draw out radioactive materials from open containers and contaminate the entire hood area.
The placement of the hood in the laboratory is important with respect to cross-drafts. In general, a hood should be located well away from doorways where supply or make-up air must enter. Dual-speed fans will permit operation at a higher air velocity while the hood is in use and a lower velocity when it is closed.
The aim of any ventilating system should be to:
- provide comfortable working conditions
- provide continuous air changes (three to five changes per hour) for the purposes of removing and diluting undesirable air contaminants
- minimize the contamination of other areas of the building and the environment.
In the design of radiation facilities, heavy shielding requirements can be minimized by the adoption of certain simple measures. For example, for radiation therapy, accelerators, neutron generators or panoramic radiation sources, a maze can reduce the need for a heavy lead-lined door. Tapering of the primary protective barrier in areas that are not directly in the useful beam or locating the facility partially or completely underground can significantly reduce the amount of required shielding.
Careful attention must be paid to the proper positioning of viewing windows, underground conduit cables and ventilation system baffles. The viewing window should intercept scattered radiation only. Even better is a closed circuit television, which can also improve efficiency.
Surface finishes within a work area
All raw surfaces, such as plaster, concrete, wood and so on, should be permanently sealed with a suitable material. The choice of material should be made with the following considerations in mind:
- the provision of a smooth, chemically inert surface
- the environmental conditions of temperature, humidity and mechanical wear and tear to which the surfaces may be exposed
- compatibility with radiation fields to which the surface is exposed
- the need for ease of repair in the event of damage.
Ordinary paints, varnishes and lacquers are not recommended for covering wear surfaces. The application of a surfacing material that can be easily removed may be helpful if contamination occurs and decontamination is required. However, the removal of such materials sometimes can be difficult and messy.
Plumbing
Sinks, wash basins and floor drains should be properly marked. Wash basins where contaminated hands may be washed should have knee- or foot-operated faucets. It may be economical to reduce maintenance by using piping which can be easily decontaminated or replaced if required. In some cases it may be advisable to install underground holding or storage tanks to control the disposal of liquid radioactive materials.
Radiation Shielding Design
Shielding is important for reducing radiation exposure of facility workers and members of the general public. Shielding requirements depend on a number of factors, including the time that radiation workers or members of the public are exposed to the radiation sources and the type and energy of the radiation sources and radiation fields.
In the design of radiation shields, the shielding material should be placed near the radiation source if possible. Separate shielding considerations must be made for each type of radiation concerned.
Shielding design can be a complex task. For example, the use of computers to model shielding for accelerators, reactors and other high-level radiation sources is beyond the scope of this article. Qualified experts always should be consulted for complex shielding design.
Gamma source shielding
The attenuation of gamma radiation is qualitatively different from that of either alpha or beta radiation. Both of those types of radiation have a definite range in matter and are completely absorbed. Gamma radiation, on the other hand, can be reduced in intensity by increasingly thicker absorbers but it cannot be completely absorbed. If the attenuation of monoenergetic gamma rays is measured under conditions of good geometry (that is, the radiation is well collimated in a narrow beam) the intensity data, when plotted on a semi-log graph versus absorber thickness, will lie on a straight line with the slope equal to the attenuation
coefficient, μ.
The intensity or absorbed dose rate transmitted through an absorber can be calculated as follows:
I(t) = I(0)e– μ t
where I(t) is the gamma-ray intensity or absorbed dose rate transmitted through an absorber of thickness t.
The units of μ and t are the reciprocal of each other. If the absorber thickness t is measured in cm, then μ is the linear attenuation coefficient and has units of cm–1. If t has units of areal density (g/cm2), then μ is the mass attenuation coefficient μm and has units of cm2/g.
As a first-order approximation using areal density, all materials have about the same photon attenuation properties for photons with energies between about 0.75 and 5.0 MeV (mega-electron volts). Within this energy range, gamma shielding properties are approximately proportional to the density of the shielding material. For lower or higher photon energies, absorbers of higher atomic number provide more effective shielding than those of lower atomic number, for a given areal density.
Under conditions of poor geometry (for example, for a broad beam or for a thick shield), the above equation will significantly underestimate the required shield thickness because it assumes that every photon that interacts with the shield will be removed from the beam and not be detected. A significant number of photons may be scattered by the shield into the detector, or photons that had been scattered out of the beam may be scattered back into it after a second interaction.
A shield thickness for conditions of poor geometry may be estimated through the use of the build-up factor B that may be estimated as follows:
I(t) = I(0)Be– μ t
The build-up factor is always greater than one, and may be defined as the ratio of the intensity of the photon radiation, including both the primary and scattered radiation, at any point in the beam, to the intensity of the primary beam only at that point. The build-up factor may apply either to radiation flux or to absorbed dose rate.
Build-up factors have been calculated for various photon energies and various absorbers. Many of the graphs or tables give the shield thickness in terms of relaxation lengths. A relaxation length is the thickness of a shield that will attenuate a narrow beam to 1/e (about 37%) of its original intensity. One relaxation length, therefore, is numerically equal to the reciprocal of the linear attenuation coefficient (that is, 1/μ).
The thickness of an absorber that, when introduced into the primary photon beam, reduces the absorbed dose rate by one-half is called the half-value layer (HVL) or half-value thickness (HVT). The HVL may be calculated as follows:
HVL = ln2 / μ
The required photon shield thickness can be estimated by assuming narrow-beam or good geometry while calculating the required shielding, and then increasing the value thus found by one HVL to account for build-up.
The thickness of an absorber that, when introduced into the primary photon beam, reduces the absorbed dose rate by one-tenth is the tenth-value layer (TVL). One TVL is equal to about 3.32 HVLs, since:
ln10 / ln2 ≈ 3.32
Values for both TVLs and HVLs have been tabulated for various photon energies and several common shielding materials (e.g., lead, steel and concrete) (Schaeffer 1973).
The intensity or absorbed dose rate for a point source obeys the inverse square law and may be calculated as follows:

where Ii is the photon intensity or absorbed dose rate at distance di from the source.
Medical and non-medical x-ray equipment shielding
Shielding for x-ray equipment is considered under the two categories, source shielding and structural shielding. Source shielding is usually provided by the manufacturer of the x-ray tube housing.
Safety regulations specify one type of protective tube housing for medical diagnostic x-ray facilities and another type for medical therapeutic x-ray facilities. For non-medical x-ray equipment, the tube housing and other parts of the x-ray apparatus, such as the transformer, are shielded to reduce the leakage x-ray radiation to acceptable levels.
All x-ray machines, both medical and non-medical, have protective tube housings designed to limit the amount of leakage radiation. Leakage radiation, as used in these specifications for tube housings, means all radiation coming from the tube housing except for the useful beam.
Structural shielding for an x-ray facility provides protection from the useful or primary x-ray beam, from leakage radiation and from scatter radiation. It encloses both the x-ray equipment and the object being irradiated.
The amount of scatter radiation depends on the x-ray field size, energy of the useful beam, the effective atomic number of the scattering media and the angle between the incoming useful beam and the direction of scatter.
A key design parameter is the facility workload (W):
![]()
where W is the weekly workload, usually given in mA-min per week; E is the tube current multiplied by the exposure time per view, usually given in mA s; Nv is the number of views per patient or object irradiated; Np is the number of patients or objects per week and k is a conversion factor (1 min divided by 60 s).
Another key design parameter is the use factor Un for a wall (or floor or ceiling) n. The wall may be protecting any occupied area such as a control room, office or waiting room. The use factor is given by:
![]()
where, Nv,n is the number of views for which the primary x ray beam is directed toward wall n.
The structural shielding requirements for a given x ray facility are determined by the following:
- the maximum tube potential, in kilovolts-peak (kVp), at which the x ray tube is operated
- the maximum beam current, in mA, at which the x ray system is operated
- the workload (W), which is a measure, in suitable units (usually mA-min per week), of the amount of use of the x ray system
- the use factor (U), which is the fraction of the workload during which the useful beam is pointed in the direction of interest
- the occupancy factor (T), which is the factor by which the workload should be multiplied to correct for the degree or type of occupancy of the area to be protected
- the maximum permissible dose equivalent rate (P) to a person for controlled and non-controlled areas (typical absorbed dose limits are 1 mGy for a controlled area in one week and 0.1 mGy for a non-controlled area in one week)
- type of shielding material (for example, lead or concrete)
- the distance (d) from the source to the location being protected.
With these considerations included, the value of the primary beam ratio or transmission factor K in mGy per mA-min at one metre is given by:
![]()
Shielding of the x-ray facility must be constructed so that protection is not impaired by joints; by openings for ducts, pipes and so on, that pass through the barriers; or by conduits, service boxes and so on, embedded in the barriers. The shielding should cover not only the back of the service boxes, but also the sides, or be extended sufficiently to offer equivalent protection. Conduits that pass through barriers should have sufficient bends to reduce the radiation to the required level. Observation windows must have shielding equivalent to that required for the partition (barrier) or door in which they are located.
Radiation therapy facilities may require door interlocks, warning lights, closed circuit television or means for audible (e.g., voice or buzzer) and visual communication between anyone who may be in the facility and the operator.
Protective barriers are of two types:
- primary protective barriers, which are sufficient to attenuate the primary (useful) beam to the required level
- secondary protective barriers, which are sufficient to attenuate leakage, scattered and stray radiation to the required level.
To design the secondary protective barrier, separately calculate the required thickness to protect against each component. If the required thicknesses are about the same, add an additional HVL to the greatest calculated thickness. If the greatest difference between the calculated thicknesses is one TVL or more, the thickest of the calculated values will suffice.
Scattered radiation intensity depends on scattering angle, energy of the useful beam, field size or scattering area, and subject composition.
When designing secondary protective barriers, the following simplifying conservative assumptions are made:
- When x rays are produced at 500 kV or less, the energy of the scattered radiation is equal to the energy of the useful beam.
- After being scattered, the x-ray energy spectrum for beams generated at voltages greater than 500 kV are degraded to that of a 500 kV beam, and the absorbed dose rate at 1 m and 90 degrees from the scatterer is 0.1% of that in the useful beam at the point of scattering.
The transmission relationship for scattered radiation is written in terms of the scattering transmission factor (Kμx) with units of mGy•m2 (mA-min)–1:
![]()
where P is the maximum weekly absorbed dose rate (in mGy), dscat is the distance from the x ray tube’s target and the object (patient), dsec is the distance from the scatterer (object) to the point of interest that the secondary barriers are meant to shield, a is the ratio of scattered radiation to incident radiation, f is the actual scattering field size (in cm2), and F is a factor accounting for the fact that x ray output increases with voltage. Smaller values of Kμx require thicker shields.
The leakage attenuation factor BLX for diagnostic x-ray systems is calculated as follows:
![]()
where d is the distance from the tube target to the point of interest and I is the tube current in mA.
The barrier attenuation relationship for therapeutic x-ray systems operating at 500 kV or less is given by:
![]()
For therapeutic x-ray tubes operating at potentials greater than 500 kV, the leakage is usually limited to 0.1% of the intensity of the useful beam at 1 m. The attenuation factor in this case is:
![]()
where Xn is the absorbed dose rate (in mGy/h) at 1 m from a therapeutic x-ray tube operated at a tube current of 1 mA.
The number n of HVLs required to obtain the desired attenuation BLX is obtained from the relationship:
![]()
or
![]()
Beta particle shielding
Two factors must be considered when designing a shield for a high-energy beta emitter. They are the beta particles themselves and the bremsstrahlung produced by beta particles absorbed in the source and in the shield. Bremsstrahlung consists of x-ray photons produced when high-speed charged particles undergo rapid deceleration.
Therefore, a beta shield often consists of a substance of low atomic number (to minimize bremsstrahlung production) that is thick enough to stop all the beta particles. This is followed by a material of high atomic number that is thick enough to attenuate bremsstrahlung to an acceptable level. (Reversing the order of the shields increases bremsstrahlung production in the first shield to a level so high that the second shield may provide inadequate protection.)
For purposes of estimating bremsstrahlung hazard, the following relationship may be used:
![]()
where f is the fraction of the incident beta energy converted into photons, Z is the atomic number of the absorber, and Eβ is the maximum energy of the beta particle spectrum in MeV. To assure adequate protection, it is normally assumed that all bremsstrahlung photons are of the maximum energy.
The bremsstrahlung flux F at a distance d from the beta source can be estimated as follows:
![]()
`Eβ is the average beta particle energy and can be estimated by:
![]()
The range Rβ of beta particles in units of areal density (mg/cm2) may be estimated as follows for beta particles with energies between 0.01 and 2.5 MeV:
![]()
where Rβ is in mg/cm2 and Eβ is in MeV.
For Eβ>2.5 MeV, the beta particle range Rβ may be estimated as follows:
![]()
where Rβ is in mg/cm2 and Eβ is in MeV.
Alpha particle shielding
Alpha particles are the least penetrating type of ionizing radiation. Because of the random nature of its interactions, the range of an individual alpha particle varies between nominal values as indicated in figure 1. Range in the case of alpha particles may be expressed in different ways: by minimum, mean, extrapolated, or maximum range. The mean range is the most accurately determinable, corresponds to the range of the “average” alpha particle, and is used most often.
Figure 1. Typical range distribution of alpha particles
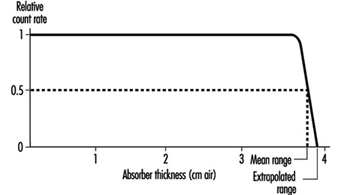
Air is the most commonly used absorbing medium for specifying the range-energy relationship of alpha particles. For alpha energy Eα less than about 4 MeV, Rα in air is approximately given by:
![]()
where Rα is in cm, Eα in MeV.
For Eα between 4 and 8 MeV, Rα in air is given approximately by:
![]()
where Rα is in cm, Eα in MeV.
The range of alpha particles in any other medium may be estimated from the following relationship:
Rα (in other medium; mg/cm2) » 0.56 A1/3 Rα (in air; cm) where A is the atomic number of the medium.
Neutron shielding
As a general rule of thumb for neutron shielding, neutron energy equilibrium is achieved and then remains constant after one or two relaxation lengths of shielding material. Therefore, for shields thicker than a few relaxation lengths, the dose equivalent outside concrete or iron shielding will be attenuated with relaxation lengths of 120 g/cm2 or 145 g/cm2, respectively.
Neutron energy loss by elastic scattering requires a hydrogenous shield to maximize the energy transfer as the neutrons are moderated or slowed down. For neutron energies above 10 MeV, inelastic processes are effective in attenuating neutrons.
As with nuclear power reactors, high-energy accelerators require heavy shielding to protect workers. Most of the dose equivalents to workers come from exposure to activated radioactive material during maintenance operations. Activation products are produced in the accelerator’s components and support systems.
Monitoring of the Workplace Environment
It is necessary to deal separately with the design of routine and of operational monitoring programs for the workplace environment. Special monitoring programs will be designed to achieve specific objectives. It is not desirable to design programs in general terms.
Routine monitoring for external radiation
An important part in the preparation of a program for routine monitoring for external radiation in the workplace is to conduct a comprehensive survey when a new radiation source or a new facility is put into service, or when any substantial changes have been made or may have been made in an existing installation.
The frequency of routine monitoring is determined by consideration of the expected changes in the radiation environment. If changes to the protective equipment or alterations of the processes conducted in the workplace are minimal or non-substantial, then routine radiation monitoring of the workplace is rarely required for review purposes. If the radiation fields are subject to increase rapidly and unpredictably to potentially hazardous levels, then an area radiation monitoring and warning system is required.
Operational monitoring for external radiation
The design of an operational monitoring program depends greatly on whether the operations to be conducted influence the radiation fields or whether the radiation fields will remain substantially constant throughout normal operations. The detailed design of such a survey depends critically on the form of the operation and on the conditions under which it takes place.
Routine monitoring for surface contamination
The conventional method of routine monitoring for surface contamination is to monitor a representative fraction of the surfaces in an area at a frequency dictated by experience. If operations are such that considerable surface contamination is likely and such that workers could carry significant amounts of radioactive material out of the work area in a single event, routine monitoring should be supplemented by the use of portal contamination monitors.
Operational monitoring for surface contamination
One form of operational monitoring is the surveying of items for contamination when they leave a radiologically controlled area. This monitoring must include workers’ hands and feet.
The principle objectives of a program of monitoring for surface contamination are:
- to assist in preventing the spread of radioactive contamination
- to detect failures of containment or departures from good operating procedures
- to limit surface contamination to levels at which general standards of good housekeeping are adequate to keep radiation exposures as low as reasonably achievable and to avoid excessive exposures caused by contamination of clothing and skin
- to provide information for the planning of optimized programs for individuals, for air monitoring and for defining operational procedures.
Monitoring for airborne contamination
The monitoring of airborne radioactive materials is important because inhalation is usually the most important route of intake of such material by radiation workers.
The monitoring of the workplace for airborne contamination will be needed on a routine basis in the following circumstances:
- when gaseous or volatile materials are handled in quantity
- when the handling of any radioactive material in such operations results in frequent and substantial contamination of the workplace
- during the processing of moderately to highly toxic radioactive materials
- during the handling of unsealed therapeutic radionuclides in hospitals
- during the use of hot cells, reactors and critical assemblies.
When an air monitoring program is required, it must:
- be able to assess the probable upper limit of the inhalation of radioactive material by radiation workers
- be able to draw attention to unexpected airborne contamination so that radiation workers can be protected and remedial measures instituted
- provide information for planning of programs of individual monitoring for internal contamination.
The most common form of monitoring for airborne contamination is the use of air samplers at a number of selected locations selected to be reasonably representative of the breathing zones of radiation workers. It may be necessary to make samples more accurately represent breathing zones by using personal air or lapel samplers.
Detection and measurement of radiation and radioactive contamination
The monitoring or surveying by wipes and instrument surveys of bench tops, floors, clothing, skin, and other surfaces are at best qualitative procedures. It is difficult to make them highly quantitative. The instruments used are usually detecting types rather than measuring devices. Since the amount of radioactivity involved is often small, the sensitivity of the instruments should be high.
The requirement for portability of contamination detectors depends on their intended uses. If the instrument is for general-purpose monitoring of laboratory surfaces, a portable type of instrument is desirable. If the instrument is for a specific use in which the item to be monitored can be brought to the instrument, then portability is not necessary. Clothing monitors and hand and shoe monitors generally are not portable.
Count-rate instruments and monitors usually incorporate meter readouts and aural outputs or earphone jacks. Table 4 identifies instruments that may be used for the detection of radioactive contamination.+
Table 4. Contamination detection instruments
|
Instrument |
Counting rate range and other characteristics1 |
Typical uses |
Remarks |
|
bg surface monitors2 |
|||
|
General |
|||
|
Portable count rate meter (thin-walled or thin window G-M3 counter) |
0-1,000 cpm |
Surfaces, hands, clothing |
Simple, reliable, battery-powered |
|
Thin end-window |
0-1,000 cpm |
Surfaces, hands, clothing |
Line-operated |
|
Personnel |
|||
|
Hand-and-shoe monitor, G-M or |
Between 1½ and 2 times natural |
Rapid monitoring for contamination |
Automatic operation |
|
Special |
|||
|
Laundry monitors, floor monitors, |
Between 1½ and 2 times natural |
Monitoring for contamination |
Convenient and rapid |
|
Alpha surface monitors |
|||
|
General |
|||
|
Portable air proportional counter with probe |
0-100,000 cpm over 100 cm2 |
Surfaces, hands, clothing |
Not for use in high humidity, battery- |
|
Portable gas-flow counter with probe |
0-100,000 cpm over 100 cm2 |
Surfaces, hands, clothing |
Battery-powered, fragile window |
|
Portable scintillation counter with probe |
0-100,000 cpm over 100 cm2 |
Surfaces, hands, clothing |
Battery-powered, fragile window |
|
Personal |
|||
|
Hand-and-shoe proportional counter-type, monitor |
0-2,000 cpm over about 300 cm2 |
Rapid monitoring of hands and shoes for contamination |
Automatic operation |
|
Hand-and-shoe scintillation counter-type, monitor |
0-4,000 cpm over about 300 cm2 |
Rapid monitoring of hands and shoes for contamination |
Rugged |
|
Wound monitors |
Low-energy photon detection |
Plutonium monitoring |
Special design |
|
Air monitors |
|||
|
Particle samplers |
|||
|
Filter paper, high-volume |
1.1 m3/min |
Quick grab samples |
Intermittent use, requires separate |
|
Filter paper, low volume |
0.2-20 m3/h |
Continuous room air monitoring |
Continuous use, requires separate |
|
Lapel |
0.03 m3/min |
Continuous breathing zone air monitoring |
Continuous use, requires separate |
|
Electrostatic precipitator |
0.09 m3/min |
Continuous monitoring |
Sample deposited on cylindrical shell, |
|
Impinger |
0.6-1.1 m3/min |
Alpha contamination |
Special uses, requires separate counter |
|
Tritium air monitors |
|||
|
Flow ionization chambers |
0-370 kBq/m3 min |
Continuous monitoring |
May be sensitive to other ionization |
|
Complete air monitoring systems |
Minimum detectable activity |
|
|
|
Fixed filter paper |
α » 0.04 Bq/m3; βγ » 0.04 Bq/m3 |
Background buildup can mask low-level activity, counter included |
|
|
Moving filter paper |
α » 0.04 Bq/m3; βγ » 0.04 Bq/m3 |
Continuous record of air activity, time of measurement can be adjusted from |
|
1 cpm = counts per minute.
2 Few surface monitors are suitable for detecting tritium (3H). Wipe tests counted by liquid scintillation devices are appropriate for detecting tritium contamination.
3 G-M = Geiger-Muller countrate meter.
Alpha contamination detectors
The sensitivity of an alpha detector is determined by its window area and window thickness. Generally window area is 50 cm2 or greater with a window areal density of 1 mg/cm2 or less. Alpha contamination monitors should be insensitive to beta and gamma radiation in order to minimize background interference. This is generally accomplished by pulse height discrimination in the counting circuit.
Portable alpha monitors can be either gas proportional counters or zinc sulphide scintillation counters.
Beta contamination detectors
Portable beta monitors of several types can be used for the detection of beta-particle contamination. Geiger-Mueller (G-M) count-rate meters generally require a thin window (areal density between 1 and 40 mg/cm2). Scintillation (anthracene or plastic) counters are very sensitive to beta particles and relatively insensitive to photons. Portable beta counters generally cannot be used to monitor for tritium (3H) contamination because tritium beta-particle energy is very low.
All instruments used for beta contamination monitoring also respond to background radiation. This must be taken into account when interpreting instrument readings.
When high background radiation levels exist, portable counters for contamination monitoring are of limited value, since they do not indicate small increases in initially high counting rates. Under these conditions smears or wipe tests are recommended.
Gamma contamination detectors
Since most gamma emitters also emit beta particles, most contamination monitors will detect both beta and gamma radiation. The usual practice is to use a detector that is sensitive to both types of radiation in order to have increased sensitivity, since the detection efficiency is usually greater for beta particles than for gamma rays. Plastic scintillators or sodium iodide (NaI) crystals are more sensitive to photons than are G-M counters, and are therefore recommended for detecting gamma rays.
Air samplers and monitors
Particulates may be sampled by the following methods: sedimentation, filtration, impaction and electrostatic or thermal precipitation. However, particulate contamination in the air is generally monitored by filtration (pumping air through filter media and measuring the radioactivity on the filter). Sampling flow rates generally are greater than 0.03 m3/min. However, most laboratories’ sampling flow rates are no more than 0.3 m3/min. Specific types of air samplers include “grab” samplers and continuous air monitors (CAM). The CAMs are available with either fixed or moving filter paper. A CAM should include an alarm since its principle function is to warn of changes in airborne contamination.
Because alpha particles have very short range, surface-loading filters (for example, membrane filters) must be used for the measurement of alpha-particle contamination. The sample collected must be thin. The time between collection and measurement must be considered to allow for the decay of radon (Rn) progeny.
Radioiodines such as 123I, 125I and 131I can be detected with filter paper (particularly if the paper is loaded with charcoal or silver nitrate) because some of the iodine will deposit on the filter paper. However, quantitative measurements require activated charcoal or silver zeolite traps or canisters to provide efficient absorption.
Tritiated water and tritium gas are the primary forms of tritium contamination. Although tritiated water has some affinity for most filter papers, filter paper techniques are not very effective for tritiated water sampling. The most sensitive and accurate measurement methods involve the absorption of tritiated water vapour condensate. Tritium in the air (for example, as hydrogen, hydrocarbons or water vapour) can be measured effectively with Kanne chambers (flow-through ionization chambers). Absorption of tritiated water vapour from an air sample can be accomplished by passing the sample through a trap containing a silica-gel molecular sieve or by bubbling the sample through distilled water.
Depending on the operation or process it may be necessary to monitor for radioactive gases. This can be accomplished with Kanne chambers. The most commonly used devices for sampling by absorption are fretted gas scrubbers and impingers. Many gases may also be collected by cooling the air below the freezing point of the gas and collecting the condensate. This method of collection is most often used for tritium oxide and noble gases.
There are a number of ways to obtain grab samples. The method selected should be appropriate for the gas to be sampled and the required method of analysis or measurement.
Monitoring of effluent
Effluent monitoring refers to the measurement of radioactivity at its point of release to the environment. It is relatively easy to accomplish because of the controlled nature of the sampling location, which is usually in a waste stream that is being discharged through a stack or liquid discharge line.
Continuous monitoring of airborne radioactivity may be necessary. In addition to the sample collection device, usually a filter, a typical sampling arrangement for particulates in air includes an air-moving device, a flowmeter and associated ducting. The air-moving device is located downstream from the sample collector; that is, the air is first passed through the sample collector, then through the remainder of the sampling system. Sampling lines, particularly those ahead of the sample collector system, should be kept as short as possible and free of sharp bends, areas of turbulence, or resistance to the air flow. Constant volume over a suitable range of pressure drops should be used for air sampling. Continuous sampling for radioactive xenon (Xe) or krypton (Kr) isotopes is accomplished by adsorption on activated charcoal or by cryogenic means. The Lucas cell is one of the oldest techniques and still the most popular method for the measurement of Rn concentrations.
Continuous monitoring of liquids and waste lines for radioactive materials is sometimes necessary. Waste lines from hot laboratories, nuclear medicine laboratories and reactor coolant lines are examples. Continuous monitoring can be performed, however, by routine laboratory analysis of a small sample proportional to the effluent flow rate. Samplers that take periodic aliquots or that continuously extract a small amount of liquid are available.
Grab sampling is the usual method used to determine the concentration of radioactive material in a hold-up tank. The sample must be taken after recirculation in order to compare the result of the measurement with allowable discharge rates.
Ideally, results of effluent monitoring and environmental monitoring will be in good agreement, with the latter calculable from the former with the aid of various pathway models. However, it must be recognized and emphasized that effluent monitoring, no matter how good or extensive, cannot substitute for actual measurement of radiological conditions in the environment.
" DISCLAIMER: The ILO does not take responsibility for content presented on this web portal that is presented in any language other than English, which is the language used for the initial production and peer-review of original content. Certain statistics have not been updated since the production of the 4th edition of the Encyclopaedia (1998)."