- You are here:
-
Home

- Part VI. General Hazards

Children categories

36. Barometric Pressure Increased (2)

36. Barometric Pressure Increased
Chapter Editor: T.J.R. Francis
Table of Contents
Working under Increased Barometric Pressure
Eric Kindwall
Dees F. Gorman
Tables
Click a link below to view table in article context.
1. Instructions for compressed-air workers
2. Decompression illness: Revised classification
37. Barometric Pressure Reduced (4)
37. Barometric Pressure Reduced
Chapter Editor: Walter Dümmer
Table of Contents
Figures and Tables
Ventilatory Acclimatization to High Altitude
John T. Reeves and John V. Weil
Physiological Effects of Reduced Barometric Pressure
Kenneth I. Berger and William N. Rom
Health Considerations for Managing Work at High Altitudes
John B. West
Prevention of Occupational Hazards at High Altitudes
Walter Dümmer
Figures
Point to a thumbnail to see figure caption, click to see figure in article context.


38. Biological Hazards (4)
38. Biological Hazards
Chapter Editor: Zuheir Ibrahim Fakhri
Table of Contents
Tables
Workplace Biohazards
Zuheir I. Fakhri
Aquatic Animals
D. Zannini
Terrestrial Venomous Animals
J.A. Rioux and B. Juminer
Clinical Features of Snakebite
David A. Warrell
Tables
Click a link below to view table in article context.
1. Occupational settings with biological agents
2. Viruses, bacteria, fungi & plants in the workplace
3. Animals as a source of occupational hazards
39. Disasters, Natural and Technological (12)
39. Disasters, Natural and Technological
Chapter Editor: Pier Alberto Bertazzi
Table of Contents
Tables and Figures
Disasters and Major Accidents
Pier Alberto Bertazzi
ILO Convention concerning the Prevention of Major Industrial Accidents, 1993 (No. 174)
Disaster Preparedness
Peter J. Baxter
Post-Disaster Activities
Benedetto Terracini and Ursula Ackermann-Liebrich
Weather-Related Problems
Jean French
Avalanches: Hazards and Protective Measures
Gustav Poinstingl
Transportation of Hazardous Material: Chemical and Radioactive
Donald M. Campbell
Radiation Accidents
Pierre Verger and Denis Winter
Case Study: What does dose mean?
Occupational Health and Safety Measures in Agricultural Areas Contaminated by Radionuclides: The Chernobyl Experience
Yuri Kundiev, Leonard Dobrovolsky and V.I. Chernyuk
Case Study: The Kader Toy Factory Fire
Casey Cavanaugh Grant
Impacts of Disasters: Lessons from a Medical Perspective
José Luis Zeballos
Tables
Click a link below to view table in article context.
1. Definitions of disaster types
2. 25-yr average # victims by type & region-natural trigger
3. 25-yr average # victims by type & region-non-natural trigger
4. 25-yr average # victims by type-natural trigger (1969-1993)
5. 25-yr average # victims by type-non-natural trigger (1969-1993)
6. Natural trigger from 1969 to 1993: Events over 25 years
7. Non-natural trigger from 1969 to 1993: Events over 25 years
8. Natural trigger: Number by global region & type in 1994
9. Non-natural trigger: Number by global region & type in 1994
10. Examples of industrial explosions
11. Examples of major fires
12. Examples of major toxic releases
13. Role of major hazard installations management in hazard control
14. Working methods for hazard assessment
15. EC Directive criteria for major hazard installations
16. Priority chemicals used in identifying major hazard installations
17. Weather-related occupational risks
18. Typical radionuclides, with their radioactive half-lives
19. Comparison of different nuclear accidents
20. Contamination in Ukraine, Byelorussia & Russia after Chernobyl
21. Contamination strontium-90 after the Khyshtym accident (Urals 1957)
22. Radioactive sources that involved the general public
23. Main accidents involving industrial irradiators
24. Oak Ridge (US) radiation accident registry (worldwide, 1944-88)
25. Pattern of occupational exposure to ionizing radiation worldwide
26. Deterministic effects: thresholds for selected organs
27. Patients with acute irradiation syndrome (AIS) after Chernobyl
28. Epidemiological cancer studies of high dose external irradiation
29. Thyroid cancers in children in Belarus, Ukraine & Russia, 1981-94
30. International scale of nuclear incidents
31. Generic protective measures for general population
32. Criteria for contamination zones
33. Major disasters in Latin America & the Caribbean, 1970-93
34. Losses due to six natural disasters
35. Hospitals & hospital beds damaged/ destroyed by 3 major disasters
36. Victims in 2 hospitals collapsed by the 1985 earthquake in Mexico
37. Hospital beds lost resulting from the March 1985 Chilean earthquake
38. Risk factors for earthquake damage to hospital infrastructure
Figures
Point to a thumbnail to see figure caption, click to see figure in article context.
|
|


Click to return to top of page
40. Electricity (3)
40. Electricity
Chapter Editor: Dominique Folliot
Table of Contents
Figures and Tables
Electricity—Physiological Effects
Dominique Folliot
Static Electricity
Claude Menguy
Prevention And Standards
Renzo Comini
Tables
Click a link below to view table in article context.
1. Estimates of the rate of electrocution-1988
2. Basic relationships in electrostatics-Collection of equations
3. Electron affinities of selected polymers
4. Typical lower flammability limits
5. Specific charge associated with selected industrial operations
6. Examples of equipment sensitive to electrostatic discharges
Figures
Point to a thumbnail to see figure caption, click to see figure in article context.


41. Fire (6)
41. Fire
Chapter Editor: Casey C. Grant
Table of Contents
Figures and Tables
Basic Concepts
Dougal Drysdale
Sources of Fire Hazards
Tamás Bánky
Fire Prevention Measures
Peter F. Johnson
Passive Fire Protection Measures
Yngve Anderberg
Active Fire Protection Measures
Gary Taylor
Organizing for Fire Protection
S. Dheri
Tables
Click a link below to view table in article context.
1. Lower & upper flammability limits in air
2. Flashpoints & firepoints of liquid & solid fuels
3. Ignition sources
4. Comparison of concentrations of different gases required for inerting
Figures
Point to a thumbnail to see figure caption, click to see figure in article context.


42. Heat and Cold (12)
42. Heat and Cold
Chapter Editor: Jean-Jacques Vogt
Table of Contents
Figures and Tables
Physiological Responses to the Thermal Environment
W. Larry Kenney
Effects of Heat Stress and Work in the Heat
Bodil Nielsen
Heat Disorders
Tokuo Ogawa
Prevention of Heat Stress
Sarah A. Nunneley
The Physical Basis of Work in Heat
Jacques Malchaire
Assessment of Heat Stress and Heat Stress Indices
Kenneth C. Parsons
Case Study: Heat Indices: Formulae and Definitions
Heat Exchange through Clothing
Wouter A. Lotens
Cold Environments and Cold Work
Ingvar Holmér, Per-Ola Granberg and Goran Dahlstrom
Prevention of Cold Stress in Extreme Outdoor Conditions
Jacques Bittel and Gustave Savourey
Cold Indices and Standards
Ingvar Holmér
Tables
Click a link below to view table in article context.
1. Electrolyte concentration in blood plasma & sweat
2. Heat Stress Index & Allowable Exposure Times: calculations
3. Interpretation of Heat Stress Index values
4. Reference values for criteria of thermal stress & strain
5. Model using heart rate to assess heat stress
6. WBGT reference values
7. Working practices for hot environments
8. Calculation of the SWreq index & assessment method: equations
9. Description of terms used in ISO 7933 (1989b)
10. WBGT values for four work phases
11. Basic data for the analytical assessment using ISO 7933
12. Analytical assessment using ISO 7933
13. Air temperatures of various cold occupational environments
14. Duration of uncompensated cold stress & associated reactions
15. Indication of anticipated effects of mild & severe cold exposure
16. Body tissue temperature & human physical performance
17. Human responses to cooling: Indicative reactions to hypothermia
18. Health recommendations for personnel exposed to cold stress
19. Conditioning programmes for workers exposed to cold
20. Prevention & alleviation of cold stress: strategies
21. Strategies & measures related to specific factors & equipment
22. General adaptational mechanisms to cold
23. Number of days when water temperature is below 15 ºC
24. Air temperatures of various cold occupational environments
25. Schematic classification of cold work
26. Classification of levels of metabolic rate
27. Examples of basic insulation values of clothing
28. Classification of thermal resistance to cooling of handwear
29. Classification of contact thermal resistance of handwear
30. Wind Chill Index, temperature & freezing time of exposed flesh
31. Cooling power of wind on exposed flesh
Figures
Point to a thumbnail to see figure caption, click to see figure in article context.
|
|


43. Hours of Work (1)
43. Hours of Work
Chapter Editor: Peter Knauth
Table of Contents
Hours of Work
Peter Knauth
Tables
Click a link below to view table in article context.
1. Time intervals from beginning shiftwork until three illnesses
2. Shiftwork & incidence of cardiovascular disorders
Figures
Point to a thumbnail to see figure caption, click to see figure in article context.


44. Indoor Air Quality (8)
44. Indoor Air Quality
Chapter Editor: Xavier Guardino Solá
Table of Contents
Figures and Tables
Indoor Air Quality: Introduction
Xavier Guardino Solá
Nature and Sources of Indoor Chemical Contaminants
Derrick Crump
Radon
María José Berenguer
Tobacco Smoke
Dietrich Hoffmann and Ernst L. Wynder
Smoking Regulations
Xavier Guardino Solá
Measuring and Assessing Chemical Pollutants
M. Gracia Rosell Farrás
Biological Contamination
Brian Flannigan
Regulations, Recommendations, Guidelines and Standards
María José Berenguer
Tables
Click a link below to view table in article context.
1. Classification of indoor organic pollutants
2. Formaldehyde emission from a variety of materials
3. Ttl. volatile organic comp’ds concs, wall/floor coverings
4. Consumer prods & other sources of volatile organic comp’ds
5. Major types & concentrations in the urban United Kingdom
6. Field measurements of nitrogen oxides & carbon monoxide
7. Toxic & tumorigenic agents in cigarette sidestream smoke
8. Toxic & tumorigenic agents from tobacco smoke
9. Urinary cotinine in non-smokers
10. Methodology for taking samples
11. Detection methods for gases in indoor air
12. Methods used for the analysis of chemical pollutants
13. Lower detection limits for some gases
14. Types of fungus which can cause rhinitis and/or asthma
15. Micro-organisms and extrinsic allergic alveolitis
16. Micro-organisms in nonindustrial indoor air & dust
17. Standards of air quality established by the US EPA
18. WHO guidelines for non-cancer and non-odour annoyance
19. WHO guideline values based on sensory effects or annoyance
20. Reference values for radon of three organizations
Figures
Point to a thumbnail to see figure caption, click to see figure in article context.
|
|


45. Indoor Environmental Control (6)
45. Indoor Environmental Control
Chapter Editor: Juan Guasch Farrás
Table of Contents
Figures and Tables
Control of Indoor Environments: General Principles
A. Hernández Calleja
Indoor Air: Methods for Control and Cleaning
E. Adán Liébana and A. Hernández Calleja
Aims and Principles of General and Dilution Ventilation
Emilio Castejón
Ventilation Criteria for Nonindustrial Buildings
A. Hernández Calleja
Heating and Air-Conditioning Systems
F. Ramos Pérez and J. Guasch Farrás
Indoor Air: Ionization
E. Adán Liébana and J. Guasch Farrás
Tables
Click a link below to view table in article context.
1. Most common indoor pollutants & their sources
2. Basic requirements-dilution ventilation system
3. Control measures & their effects
4. Adjustments to working environment & effects
5. Effectiveness of filters (ASHRAE standard 52-76)
6. Reagents used as absorbents for contaminents
7. Levels of quality of indoor air
8. Contamination due to the occupants of a building
9. Degree of occupancy of different buildings
10. Contamination due to the building
11. Quality levels of outside air
12. Proposed norms for environmental factors
13. Temperatures of thermal comfort (based on Fanger)
14. Characteristics of ions
Figures
Point to a thumbnail to see figure caption, click to see figure in article context.
|
|


46. Lighting (3)
46. Lighting
Chapter Editor: Juan Guasch Farrás
Table of Contents
Figures and Tables
Types of Lamps and Lighting
Richard Forster
Conditions Required for Visual
Fernando Ramos Pérez and Ana Hernández Calleja
General Lighting Conditions
N. Alan Smith
Tables
Click a link below to view table in article context.
1. Improved output & wattage of some 1,500 mm fluorescent tube lamps
2. Typical lamp efficacies
3. International Lamp Coding System (ILCOS) for some lamp types
4. Common colours & shapes of incandescent lamps & ILCOS codes
5. Types of high-pressure sodium lamp
6. Colour contrasts
7. Reflection factors of different colours & materials
8. Recommended levels of maintained illuminance for locations/tasks
Figures
Point to a thumbnail to see figure caption, click to see figure in article context.
|
|


47. Noise (5)
47. Noise
Chapter Editor: Alice H. Suter
Table of Contents
Figures and Tables
The Nature and Effects of Noise
Alice H. Suter
Noise Measurement and Exposure Evaluation
Eduard I. Denisov and German A. Suvorov
Engineering Noise Control
Dennis P. Driscoll
Hearing Conservation Programmes
Larry H. Royster and Julia Doswell Royster
Standards and Regulations
Alice H. Suter
Tables
Click a link below to view table in article context.
1. Permissible exposure limits (PEL)for noise exposure, by nation
Figures
Point to a thumbnail to see figure caption, click to see figure in article context.


48. Radiation: Ionizing (6)
48. Radiation: Ionizing
Chapter Editor: Robert N. Cherry, Jr.
Table of Contents
Introduction
Robert N. Cherry, Jr.
Radiation Biology and Biological Effects
Arthur C. Upton
Sources of Ionizing Radiation
Robert N. Cherry, Jr.
Workplace Design for Radiation Safety
Gordon M. Lodde
Radiation Safety
Robert N. Cherry, Jr.
Planning for and Management of Radiation Accidents
Sydney W. Porter, Jr.
49. Radiation, Non-Ionizing (9)
49. Radiation, Non-Ionizing
Chapter Editor: Bengt Knave
Table of Contents
Tables and Figures
Electric and Magnetic Fields and Health Outcomes
Bengt Knave
The Electromagnetic Spectrum: Basic Physical Characteristics
Kjell Hansson Mild
Ultraviolet Radiation
David H. Sliney
Infrared Radiation
R. Matthes
Light and Infrared Radiation
David H. Sliney
Lasers
David H. Sliney
Radiofrequency Fields and Microwaves
Kjell Hansson Mild
VLF and ELF Electric and Magnetic Fields
Michael H. Repacholi
Static Electric and Magnetic Fields
Martino Grandolfo
Tables
Click a link below to view table in article context.
1. Sources and exposures for IR
2. Retinal thermal hazard function
3. Exposure limits for typical lasers
4. Applications of equipment using range >0 to 30 kHz
5. Occupational sources of exposure to magnetic fields
6. Effects of currents passing through the human body
7. Biological effects of various current density ranges
8. Occupational exposure limits-electric/magnetic fields
9. Studies on animals exposed to static electric fields
10. Major technologies and large static magnetic fields
11. ICNIRP recommendations for static magnetic fields
Figures
Point to a thumbnail to see figure caption, click to see figure in article context.
|
|


50. Vibration (4)
50. Vibration
Chapter Editor: Michael J. Griffin
Table of Contents
Table and Figures
Vibration
Michael J. Griffin
Whole-body Vibration
Helmut Seidel and Michael J. Griffin
Hand-transmitted Vibration
Massimo Bovenzi
Motion Sickness
Alan J. Benson
Tables
Click a link below to view table in article context.
1. Activities with adverse effects of whole-body vibration
2. Preventive measures for whole-body vibration
3. Hand-transmitted vibration exposures
4. Stages, Stockholm Workshop scale, hand-arm vibration syndrome
5. Raynaud’s phenomenon & hand-arm vibration syndrome
6. Threshold limit values for hand-transmitted vibration
7. European Union Council Directive: Hand-transmitted vibration (1994)
8. Vibration magnitudes for finger blanching
Figures
Point to a thumbnail to see figure caption, click to see figure in article context.
|
|


51. Violence (1)
51. Violence
Chapter Editor: Leon J. Warshaw
Table of Contents
Violence in the Workplace
Leon J. Warshaw
Tables
Click a link below to view table in article context.
1. Highest rates of occupational homicide, US workplaces, 1980-1989
2. Highest rates of occupational homicide US occupations, 1980-1989
3. Risk factors for workplace homicides
4. Guides for programmes to prevent workplace violence
52. Visual Display Units (11)
52. Visual Display Units
Chapter Editor: Diane Berthelette
Table of Contents
Tables and Figures
Overview
Diane Berthelette
Characteristics of Visual Display Workstations
Ahmet Çakir
Ocular and Visual Problems
Paule Rey and Jean-Jacques Meyer
Reproductive Hazards - Experimental Data
Ulf Bergqvist
Reproductive Effects - Human Evidence
Claire Infante-Rivard
Case Study: A Summary of Studies of Reproductive Outcomes
Musculoskeletal Disorders
Gabriele Bammer
Skin Problems
Mats Berg and Sture Lidén
Psychosocial Aspects of VDU Work
Michael J. Smith and Pascale Carayon
Ergonomic Aspects of Human - Computer Interaction
Jean-Marc Robert
Ergonomics Standards
Tom F.M. Stewart
Tables
Click a link below to view table in article context.
1. Distribution of computers in various regions
2. Frequency & importance of elements of equipment
3. Prevalence of ocular symptoms
4. Teratological studies with rats or mice
5. Teratological studies with rats or mice
6. VDU use as a factor in adverse pregnancy outcomes
7. Analyses to study causes musculoskeletal problems
8. Factors thought to cause musculoskeletal problems
Figures
Point to a thumbnail to see figure caption, click to see figure in article context.
|
|


Motion Sickness
Motion sickness, or kinetosis, is not a pathological condition, but is a normal response to certain motion stimuli with which the individual is unfamiliar and to which he or she is, therefore, unadapted; only those without a functioning vestibular apparatus of the inner ear are truly immune.
Motions producing sickness
There are many different types of provocative motion that induce the motion sickness syndrome. Most are associated with aids to locomotion—in particular, ships, hovercraft, aircraft, automobiles and trains; less commonly, elephants and camels. The complex accelerations generated by fairground amusements, such as swings, roundabouts (merry-go-rounds), roller-coasters and so on, can be highly provocative. In addition, many astronauts/cosmonauts suffer from motion sickness (space-motion sickness) when they first make head movements in the abnormal force environment (weightlessness) of orbital flight. The motion sickness syndrome is also produced by certain moving visual stimuli, without any physical motion of the observer; the external visual world display of fixed-base simulators (simulator sickness) or a large-screen projection of scenes taken from a moving vehicle (Cinerama or IMAX sickness) are examples.
Aetiology
The essential characteristics of stimuli that induce motion sickness is that they generate discordant information from the sensory systems that provide the brain with information about the spatial orientation and motion of the body. The principal feature of this discord is a mismatch between the signals provided, principally, by the eyes and inner ear, and those that the central nervous system “expects” to receive and to be correlated.
Several categories of mismatch can be identified. Most important is the mismatch of signals from the vestibular apparatus (labyrinth) of the inner ear, in which the semicircular canals (the specialized receptors of angular accelerations) and the otolith organs (the specialized receptors of translational accelerations) do not provide concordant information. For example, when a head movement is made in a car or aircraft which is turning, both the semicircular canals and the otoliths are stimulated in an atypical manner and provide erroneous and incompatible information, information that differs substantially from that generated by the same head movement in a stable, 1-G gravity environment. Likewise, low-frequency (below 0.5 Hz) linear accelerations, such as occur aboard ship in rough seas or in an aircraft during flight through turbulent air, also generate conflicting vestibular signals and, hence, are a potent cause of motion sickness.
The mismatch of visual and vestibular information can also be an important contributory factor. The occupant of a moving vehicle who cannot see out is more likely to suffer from motion sickness than one who has a good external visual reference. The passenger below deck or in an aircraft cabin senses motion of the vehicle by vestibular cues, but he or she receives visual information only of his or her relative movement within the vehicle. The absence of an “expected” and concordant signal in a particular sensory modality is also considered to be the essential feature of visually induced motion sickness, because the visual motion cues are not accompanied by the vestibular signals that the individual “expects” to occur when subjected to the motion indicated by the visual display.
Signs and symptoms
On exposure to provocative motion, the signs and symptoms of motion sickness develop in a definite sequence, the time scale being dependent upon the intensity of the motion stimuli and the susceptibility of the individual. There are, however, considerable differences among individuals not only in susceptibility, but also in the order in which particular signs and symptoms develop, or whether they are experienced at all. Typically, the earliest symptom is epigastric discomfort (“stomach awareness”); this is followed by nausea, pallor and sweating, and is likely to be accompanied by a feeling of bodily warmth, increased salivation and eructation (belching). These symptoms commonly develop relatively slowly, but with continuing exposure to the motion, there is a rapid deterioration in well-being, the nausea increases in severity and culminates in vomiting or retching. Vomiting may bring relief, but this is likely to be short-lived unless the motion ceases.
There are other more variable features of the motion sickness syndrome. Alteration of respiratory rhythm with sighing and yawning may be an early symptom, and hyperventilation may occur, particularly in those who are anxious about the cause or consequence of their disability. Headache, tinnitus and dizziness are reported, while in those with severe malaise, apathy and depression are not uncommon, and may be of such severity that personal safety and survival are neglected. A feeling of lethargy and somnolence may be dominant following the cessation of provocative motion, and these may be the only symptoms in situations where adaptation to unfamiliar motion takes place without malaise.
Adaptation
With continued or repeated exposure to a particular provocative motion, most individuals show a decrease in the severity of symptoms; typically after three or four days of continuous exposure (as aboard ship or in a space vehicle) they have adapted to the motion and can carry out their normal duties without disability. In terms of the “mismatch” model, this adaptation or habituation represents the establishment of a new set of “expectations” in the central nervous system. However, on return to a familiar environment, these will no longer be appropriate and symptoms of motion sickness can recur (mal de débarquement) until readaptation occurs. Individuals differ considerably in the rate at which they adapt, the way they retain adaptation and the degree to which they can generalize protective adaptation from one motion environment to another. Unfortunately, a small proportion of the population (probably about 5%) do not adapt, or adapt so slowly that they continue to experience symptoms throughout the period of exposure to provocative motion.
Incidence
The incidence of sickness in a particular motion environment is governed by a number of factors, notably:
- the physical characteristics of the motion (its intensity, frequency and direction of action)
- the duration of exposure
- the intrinsic susceptibility of the individual
- the task being performed
- other environmental factors (e.g., odour).
Not surprisingly, the occurrence of sickness varies widely in different motion environments. For example: nearly all the occupants of life rafts in rough seas will vomit; 60% of student aircrew members suffer from air sickness at some time during training, which in 15%is sufficiently severe to interfere with training; in contrast, less than 0.5% of passengers in civil transport aircraft are affected, although the incidence is higher in small commuter aircraft flying at low altitude in turbulent air.
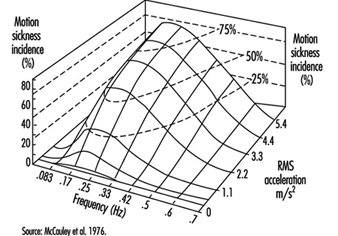
Laboratory and field studies have shown that for vertical translational oscillatory motion (appropriately called heave), oscillation at a frequency of about 0.2 Hz is the most provocative (figure 1). For a given intensity (peak acceleration) of oscillation, the incidence of sickness falls quite rapidly with an increase in frequency above 0.2 Hz; motion at 1 Hz is less than one-tenth as provocative as that at 0.2 Hz. Likewise, for motion at frequencies below 0.2 Hz, although the relationship between incidence and frequency is not well defined because of a lack of experimental data; certainly, a stable, zero frequency, 1-G environment is not provocative.
Figure 1. Motion sickness incidence as a function of wave frequency and acceleration for 2 hour exposure to vertical sinusoidal motion
Relationships established between the incidence of symptoms of motion sickness and the frequency, magnitude and duration of heave (z-axis) motion have led to the development of simple formulae that can be used to predict incidence when the physical parameters of the motion are known. The concept, embodied in British Standard 6841 (BSI 1987b) and in ISO Draft International Standard 2631-1, is that the incidence of symptoms is proportional to the Motion Sickness Dose Value (MSDVz). The MSDVz (in m/s1.5) is defined:
MSDVz=(a2t)½
where a is the root-mean-square (r.m.s.) value of the frequency-weighted acceleration (in m/s2) determined by linear integration over the duration, t (in seconds), of exposure to the motion.
The frequency weighting to be applied to the stimulus acceleration is a filter having a centre frequency and attenuation characteristics similar to those depicted in figure 1. The weighting function is defined precisely in the standards.
The percentage of an unadapted adult population (P) who are likely to vomit is given by:
P =1/3 MSDVz
Furthermore, the MSDVz may also be used to predict the level of malaise. On a four-point scale of zero (I felt all right) to three (I felt absolutely dreadful) an “illness rating” (I) is given by:
I =0.02MSDVz
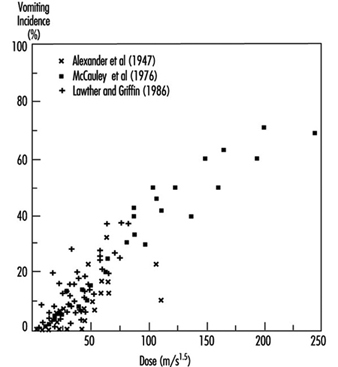
Given the large differences among individuals in their susceptibility to motion sickness, the relationship between MSDVz and the occurrence of vomiting in laboratory experiments and in sea trials (figure 2) is acceptable. It should be noted that the formulae were developed from data acquired on exposures lasting from about 20 minutes to six hours with vomiting occurring in up to 70% of individuals (mostly seated) exposed to vertical, heave, motion.
Figure 2. Relationship between incidence of vomiting and stimulus dose (MSDV2), calculated by the procedure described in the text. Data from laboratory experiments volving vertical oscillation (x) and sea trials (+)
Knowledge about the effectiveness of translational oscillation acting in other body axes and other than in a vertical direction is fragmentary. There is some evidence from laboratory experiments on small groups of subjects that translational oscillation in a horizontal plane is more provocative, by a factor of about two, than the same intensity and frequency of vertical oscillation for seated subjects, but is less provocative, also by a factor of two, when the subject is supine and the stimulus acts in the longitudinal (z) body axis. Application of formulae and weighting characteristics embodied in standards to the prediction of sickness incidence should, therefore, be made with caution and due concern for the constraints noted above.
The considerable variability between individuals in their response to provocative motion is an important feature of motion sickness. Differences in susceptibility can, in part, be related to constitutional factors. Infants much below the age of about two years are rarely affected, but with maturation, susceptibility increases rapidly to reach a peak between four and ten years. Thereafter, susceptibility falls progressively so that the elderly are less likely to be affected, but are not immune. In any age group, females are more sensitive than males, the incidence data suggesting a ratio of approximately 1.7:1. Certain dimensions of personality, such as neuroticism, introversion and perceptual style have also been shown to be correlated, albeit weakly, with susceptibility. Motion sickness can also be a conditioned response and a manifestation of phobic anxiety.
Preventive measures
Procedures which minimize the provocative stimulus or increase the tolerance are available. These may prevent sickness in a proportion of the population, but none, other than withdrawal from the motion environment, is 100%effective. In the design of a vehicle, attention to factors which raise the frequency and reduce the magnitude of the oscillations (see figure 1) experienced by occupants during normal operation is beneficial. The provision of head support and body restraint to minimize the unnecessary head movements is advantageous, and is further aided if the occupant can assume a reclined or supine position. Sickness is less if the occupant can be given a view of the horizon; for those deprived of an external visual reference, closing the eyes reduces visual/vestibular conflict. Involvement in a task, particularly control of the vehicle, is also helpful. These measures can be of immediate benefit, but in the longer term the development of protective adaptation is of the greatest value. This is achieved by continued and repeated exposure to the motion environment, though it can be facilitated by ground-based exercises in which provocative stimuli are generated by making head movements whilst rotating on a spin table (desensitization therapy).
There are several drugs which increase tolerance, though all have side-effects (in particular, sedation), so that they should not be taken by those in primary control of a vehicle or when optimum performance is mandatory. For short-term (less than four hours) prophylaxis, 0.3 to 0.6 mg hyoscine hydrobromide (scopolamine) is recommended; longer acting are the antihistaminics, promethazine hydrochloride (25 mg), meclozine hydrochloride (50 mg), dimenhydrinate (50 mg) and cinnarizine (30 mg). The combination of either hyoscine or promethazine with 25 mg ephedrine sulphate increases prophylactic potency with some reduction of side-effects. Prophylaxis for up to 48 hours can be achieved using a scopolamine patch, which allows the drug to be slowly absorbed through the skin at a controlled rate. Effective concentrations of the drug in the body are not achieved until six to eight hours after application of the patch, so the need for this type of therapy must be anticipated.
Treatment
Those suffering from established motion sickness with vomiting should, when practicable, be placed in a position where the motion stimulus is minimized, and be given an anti–motion sickness drug, preferably promethazine by injection. Should vomiting be prolonged and repeated, intravenous replacement of fluid and electrolytes may be necessary.
Violence in the Workplace
Violence is pervasive in modern society and appears to be escalating. Entirely apart from repression, wars and terrorist activities, the media daily report in banner headlines on the mayhem inflicted by humans upon each other in “civilized” as well as more primitive communities. Whether there has been a real increase or this simply represents more thorough reporting is arguable. After all, violence has been a feature of human interaction since prehistoric ages. Nevertheless, violence has become one of the leading causes of death in modern industrial societies—in some segments of the community it is the leading cause of death—and it is increasingly being recognized as a public health problem.
Inescapably, it finds its way into the workplace. From 1980 to 1989, homicide was the third leading cause of death from injury in North American workplaces, according to data compiled by the National Traumatic Occupational Facilities Surveillance System (NIOSH 1993a). During this period, occupational homicides accounted for 12% of deaths from injury in the workplace; only motor vehicles and machines accounted for more. By 1993, that figure had risen to 17%, a rate of 0.9 per 100,000 workers, now second only to motor vehicle deaths (Toscano and Windau 1994). For women workers, it remained the leading cause of work-related death, although the rate (0.4 deaths per 100,000) was lower than that for men (1.2 deaths per 100,000) (Jenkins 1995).
These deaths, however, represent only the “tip of the iceberg”. For example, in 1992, about 22,400 American workers were injured seriously enough in non-fatal assaults in the workplace to require days away from work to recuperate (Toscano and Windau 1994). Reliable and complete data are lacking, but it is estimated that for every death there have been many thousands—perhaps, even hundreds of thousands—of instances of violence in the workplace.
In its newsletter, Unison, the large British union of health care and governmental service workers, has labelled violence as “the most threatening risk faced by members at work. It is the risk which is most likely to lead to injury. It can bring unmanageable levels of occupational stress which damages personal esteem and threatens people’s ability to continue on the job” (Unison 1992).
This article will summarize the characteristics of violence in the workplace, the kinds of people involved, its effects on them and their employers, and the steps that may be taken to prevent or control such effects.
Definition of Violence
There is no consensus on the definition of violence. For example, Rosenberg and Mercy (1991) include in the definition both fatal and nonfatal interpersonal violence where physical force or other means is used by one person with the intent of causing harm, injury or death to another. The Panel on the Understanding and Control of Violent Behavior convened by the US National Academy of Sciences adopted the definition of violence as: behaviours by individuals that intentionally threaten, attempt or inflict physical harm on others (Reiss and Roth 1993).
These definitions focus on threatening or causing physical harm. However, they exclude instances in which verbal abuse, harassment or humiliation and other forms of psychological trauma may be the sole harm to the victim and which may be no less devastating. They also exclude sexual harassment, which may be physical but which is usually entirely non-physical. In the national survey of American workers conducted by the Northwestern National Life Insurance Company, the researchers separated violent acts into: harassment (the act of creating a hostile environment through unwelcome words, actions or physical contacts not resulting in physical harm), threats (expressions of an intent to cause physical harm), and physical attacks (aggression resulting in a physical assault with or without the use of a weapon) (Lawless, 1993).
In the UK, the Health and Safety Executive’s working definition of workplace violence is: any incident in which an employee is abused, threatened or assaulted by a member of the public in circumstances arising out of the course of his or her employment. Assailants may be patients, clients or co-workers (MSF 1993).
In this article, the term violence will be used in its broadest sense to include all forms of aggressive or abusive behaviour that may cause physical or psychological harm or discomfort to its victims, whether they be intentional targets or innocent bystanders involved only impersonally or incidentally. While workplaces may be targets of terrorist attacks or may become involved in riots and mob violence, such instances will not be discussed.
Prevalence of Violence in the Workplace
Accurate information on the prevalence of violence in the workplace is lacking. Most of the literature focuses on cases that are formally reported: homicides which get tallied in the obligatory death registries, cases that get enmeshed in the criminal justice system, or cases involving time off the job that generate workers’ compensation claims. Yet, for every one of these, there is an untold number of instances in which workers are victims of aggressive, abusive behaviour. For example, according to a survey conducted by the Bureau of Justice Statistics in the US Department of Justice, over half the victimizations sustained at work were not reported to the police. About 40% of the respondents said they did not report the incident because they considered it to be a minor or a personal matter, while another 27% said they did report it to a manager or a company security officer but, apparently, the report was not relayed to the police (Bachman 1994). In addition to the lack of a consensus on a taxonomy of violence, other reasons for under-reporting include:
- Cultural acceptance of violence. There is in many communities a widespread tolerance for violence among or against certain groups (Rosenberg and Mercy 1991). Although frowned upon by many, violence is often rationalized and tolerated as a “normal” response to competition. Violence among minority and ethnic groups is often condoned as a righteous response to discrimination, poverty and lack of access to social or economic equity resulting in low self-esteem and low valuations of human life. As a result, the assault is seen as a consequence of living in a violent society rather than working in an unsafe workplace. Finally, there is the “on-the-job syndrome”, in which workers in certain jobs are expected to put up with verbal abuse, threats and, even, physical attacks (SEIU 1995; Unison 1992).
- Lack of a reporting system. Only a small proportion of organizations have articulated an explicit policy on violence or have designed procedures for reporting and investigating instances of alleged violence in the workplace. Even where such a system has been installed, the trouble of obtaining, completing and filing the required report form is a deterrent to reporting all but the most outrageous incidents.
- Fear of blame or reprisal. Workers may fear being held responsible when they have been attacked by a client or a patient. Fear of reprisal by the assailant is also a potent deterrent to reporting, especially when that person is the worker’s superior and in a position to affect his or her job status.
- Lack of interest on the part of the employer. The employer’s lack of interest in investigating and reacting to prior incidents will certainly discourage reporting. Also, supervisors, concerned that workplace violence might reflect unfavourably on their managerial capabilities may actually discourage or even block the filing of reports by workers in their units.
To determine the prevalence of violence in the workplace in the absence of reliable data, attempts have been made to extrapolate both from available statistics (e.g., death certificates, crime reports and workers’ compensation systems) and from specially designed surveys. Thus, the US National Crime Victimization Survey estimated that about 1 million American workers (out of a workforce of 110 million) are assaulted at work each year (Bachman 1994). And, a 1993 telephone survey of a national sample of 600 American full-time workers (excluding self-employed and military personnel) found that one in four said that he or she had been a victim of workplace violence during the study year: 19%ere harassed, 7% were threatened, and 3% were attacked physically. The researchers reported further that 68%of the harassment victims, 43% of the threat victims and 24% of the attack victims had not reported the incident (Lawless 1993).
A similar survey of workers in the UK employed by the National Health Service revealed that, during the previous year, 0.5% had required medical treatment following an on-the-job physical assault; 11% had suffered a minor injury requiring only first aid, 4 to 6% had been threatened by persons wielding a deadly weapon, and 17% had received verbal threats. Violence was a special problem for emergency staff in ambulances and accident departments, nurses, and workers involved in the care of psychologically disturbed patients (Health Services Advisory Committee 1987). The risk of health workers being confronted by violence has been labelled a feature of everyday work in primary care and in accident/emergency departments (Shepherd 1994).
Homicide in the Workplace
Although workplace homicides are only a small proportion of all homicides, their substantial contribution to work-related deaths, at least in the United States, their unique features, and the possibility of preventive interventions by employers earn them special attention. For example, while most homicides in the community involve people who know each other, many of them close relatives, and only 13% were reported to have been associated with another felony, these proportions were reversed in the workplace, where more than three-fourths of the homicides were committed in the course of a robbery (NIOSH 1992). Further, while persons aged 65 and older in the general population have the lowest rates of being victims of homicide, this age group has the highest rates of such involvement in workplace homicides (Castillo and Jenkins 1994).
American workplaces with the highest rates of homicide are listed in table 1. Over 50% are accounted for by only two industries: retail trade and services. The latter includes taxi driving, which has nearly 40 times the average workplace homicide rate, followed by liquor/convenience stores and gas stations, prime targets for robberies, and by detective/protective services (Castillo and Jenkins 1994).
Table 1. US workplaces with the highest rates of occupational homicide, 1980-1989
|
Workplaces |
No. of homicides |
Rate1 |
|
Taxicab establishments |
287 |
26.9 |
|
Liquor stores |
115 |
8.0 |
|
Gas stations |
304 |
5.6 |
|
Detective/protective services |
152 |
5.0 |
|
Justice/public order establishments |
640 |
3.4 |
|
Grocery stores |
806 |
3.2 |
|
Jewellery stores |
56 |
3.2 |
|
Hotels/motels |
153 |
3.2 |
|
Eating/drinking places |
754 |
1.5 |
1 Number per 100,000 workers per year.
Source: NIOSH 1993b.
Table 2 lists the occupations with the highest rates of workplace homicides. Again, reflecting the likelihood of involvement in attempted felonies, taxi drivers head the list, followed by law-enforcement personnel, hotel clerks and workers in various types of retail establishments. Commenting on similar data from the UK, Drever (1995) noted that most of the occupations with the highest mortality from homicides had high rates of drug dependence (scaffolders, literary and artistic occupations, painters and decorators) or alcohol abuse (cooks and kitchen porters, publicans, bartenders and caterers).
Table 2. US occupations with the highest rates of occupational homicide, 1980-1989
|
Occupations |
No. of homicides |
Rate1 |
|
Taxicab drivers/chauffeurs |
289 |
15.1 |
|
Law enforcement officers |
520 |
9.3 |
|
Hotel clerks |
40 |
5.1 |
|
Gas station workers |
164 |
4.5 |
|
Security guards |
253 |
3.6 |
|
Stock handlers/baggers |
260 |
3.1 |
|
Store owners/managers |
1,065 |
2.8 |
|
Bartenders |
84 |
2.1 |
1 Number per 100,000 workers per year.
Source: NIOSH 1993b.
As noted above, the vast majority of work-related homicides occur during the course of a robbery or other crime committed by a person or persons usually not known to the victim. Risk factors associated with such incidents are listed in table 3.
Table 3. Risk factors for workplace homicides
Working alone or in small numbers
Exchange of money with the public
Working late night or early morning hours
Working in high crime areas
Guarding valuable property or possessions
Working in community settings (e.g. taxi drivers and police)
Source: NIOSH 1993b.
About 4% of workplace homicides occur during confrontations with family members or acquaintances who have followed the victim into the workplace. About 21% arise out of a confrontation related to the workplace: about two-thirds of these are perpetrated by workers or former employees with a grudge against a manager or a co-worker, while angry customers or clients account for the rest (Toscano and Windau 1994). In these cases, the target may be the particular manager or worker whose actions provoked the assault or, where there is a grudge against the organization, the target may be the workplace itself, and any employees and visitors who just happen to be in it at the critical moment. Sometimes, the assailant may be emotionally disturbed, as in the case of Joseph T. Weisbecker, an employee on long-term disability leave from his employer in Louisville, Kentucky, because of mental illness, who killed eight co-workers and injured 12 others before taking his own life (Kuzmits 1990).
Causes of Violence
Current understanding of the causes and risk factors for assaultive violence is very rudimentary (Rosenberg and Mercy 1991). Clearly, it is a multifactorial problem in which each incident is shaped by the characteristics of the assailant, the characteristics of the victim(s) and the nature of the interplay between them. Reflecting such complexity, a number of theories of causation have been developed. Biological theories, for example, focus on such factors as gender (most of the assailants are male), age (involvement in violence in the community diminishes with age but, as noted above, this is not so in the workplace), and the influence of hormones such as testosterone, neurotransmitters such as serotonin, and other such biological agents. The psychological approach focuses on personality, holding that violence is engendered by deprivation of love during childhood, and childhood abuse, and is learned from role models, reinforced by rewards and punishments in early life. Sociological theories emphasize as breeders of violence such cultural and subcultural factors as poverty, discrimination and lack of economic and social equity. Finally, interactional theories converge on a sequence of actions and reactions that ultimately escalate into violence (Rosenberg and Mercy 1991).
A number of risk factors have been associated with violence. They include:
Mental illness
The vast majority of people who are violent are not mentally ill, and the vast proportion of individuals with mental illness are not violent (American Psychiatric Association 1994). However, mentally disordered individuals are sometimes frightened, irritable, suspicious, excitable, or angry, or a combination of these (Bullard 1994). The resultant behaviour poses a particular risk of violence to the physicians, nurses and staff members involved in their care in ambulances, emergency departments and both inpatient and outpatient psychiatric facilities.
Certain types of mental illness are associated with a greater propensity for violence. Persons with psychopathic personalities tend to have a low threshold for anger and frustration, which often generate violent behaviour (Marks 1992), while individuals with paranoia are suspicious and prone to attack individuals or entire organizations whom they blame when things do not go as they would wish. However, violence may be exhibited by persons with other forms of mental illness. Furthermore, some mentally ill individuals are prone to episodes of acute dementia in which they may inflict violence on themselves as well as on those trying to restrain them.
Alcohol and drug abuse
Alcohol abuse has a strong association with aggressive and violent behaviour. While drunkenness on the part of either assailants or victims, or both, often results in violence, there is disagreement as to whether alcohol is the cause of the violence or merely one of a number of factors involved in its causation (Pernanen 1993). Fagan (1993) emphasized that while alcohol affects neurobiological functions, perception and cognition, it is the immediate setting in which the drinking takes place that channels the disinhibiting responses to alcohol. This was confirmed by a study in Los Angeles County which found that violent incidents were much more frequent in some bars and relatively uncommon in others where just as much drinking was taking place, and concluded that violent behaviour was not related to the amount of alcohol being consumed but, rather, to the kinds of individuals attracted to a particular drinking establishment and the kinds of unwritten rules in effect there (Scribner, MacKinnon and Dwyer 1995).
Much the same may be said for abuse of illicit drugs. Except perhaps for crack cocaine and the amphetamines, drug use is more likely to be associated with sedation and withdrawal rather than aggressive, violent behaviour. Most of the violence associated with illegal drugs seems to be associated not with the drugs, but with the effort to obtain them or the wherewithal to purchase them, and from involvement in the illegal drug traffic.
Violence in the community
Violence in the community not only spills over into workplaces but is a particular risk factor for workers such as police and firefighters, and for postal workers and other government employees, repair and service personnel, social workers and others whose jobs take them into neighbourhoods in which violence and crime are indigenous. Important factors in the frequency of violence, particularly in the United States, is the prevalence of firearms in the hands of the general public and, especially for young people, the amount of violence depicted in films and on television.
Work-Related Factors Associated with Violence
Instances of violence may occur in any and all workplaces. There are, however, certain jobs and work-related circumstances that are particularly associated with a risk of generating or being subjected to violence. They include:
Criminal activities
Perhaps the least complex of episodes of work-related violence are those associated with criminal violence, the major cause of worksite homicides. These fall into two categories: those involved with attempts at robbery or other felonies, and those related to traffic in illicit drugs. Police, security guards and other personnel with law-enforcement responsibilities face a constant risk of attack by felons attempting to enter the workplace and those resisting detection and arrest. Those working alone and field workers whose duties take them into high-crime neighbourhoods are frequent targets of robbery attempts. Health professionals making home visits to such areas are particularly at risk because they often carry drugs and drug paraphernalia such as hypodermic syringes and needles.
Dealing with the public
Workers in government and private community service agencies, banks and other institutions serving the public are frequently confronted by attacks from individuals who have been kept waiting unduly, have been greeted with disinterest and indifference (whether real or perceived), or were thwarted in obtaining the information or services they desired because of complicated bureaucratic procedures or technicalities that made them ineligible. Clerks in retail establishments receiving items being returned, workers staffing airport ticket counters when flights are overbooked, delayed or cancelled, urban bus or trolley drivers and conductors, and others who must deal with customers or clients whose wants cannot immediately be satisfied are often targets for verbal and sometimes even physical abuse. Then, there are also those who must contend with impatient and unruly crowds, such as police officers, security guards, ticket takers and ushers at popular sporting and entertainment events.
Violent attacks on government workers, particularly those in uniform, and on government buildings and offices in which workers and visitors may be indiscriminately injured or killed, may result from resentment and anger at laws and official policies which the perpetrators will not accept.
Work stress
High levels of work stress may precipitate violent behaviour, while violence in the workplace can, in turn, be a potent stressor. The elements of work stress are well known (see chapter Psychosocial and Organizational Factors). Their common denominator is a devaluation of the individual and/or the work he or she performs, resulting in fatigue, frustration and anger directed at managers and co-workers perceived to be inconsiderate, unfair and abusive. Several recent population studies have demonstrated an association between violence and job loss, one of the most potent job-related stressors (Catalano et al. 1993; Yancey et al. 1994).
Interpersonal environment in the workplace
The interpersonal environment in the workplace may be a breeding ground for violence. Discrimination and harassment, forms of violence in themselves as defined in this article, may provoke violent retaliation. For example, MSF, the British union of workers in management, science and finance, calls attention to workplace bullying (defined as persistent offensive, abusive, intimidating, malicious or insulting behaviour, abuse of power or unfair penal sanctions), as a characteristic of the management style in some organizations (MSF 1995).
Sexual harassment has been branded a form of assault on the job (SEIU 1995). It may involve unwelcome touching or patting, physical assault, suggestive remarks or other verbal abuse, staring or leering, requests for sexual favours, compromising invitations, or a work environment made offensive by pornography. It is illegal in the United States, having been declared a form of sexual discrimination under Title VII of the Civil Rights Act of 1964 when the worker feels that his or her job status depends on tolerating the advances or if the harassment creates an intimidating, hostile or offensive workplace environment.
Although women are the usual targets, men have also been sexually harassed, albeit much less frequently. In a 1980 survey of US federal employees, 42% of female respondents and 15% of males said that they had been sexually harassed on the job, and a follow-up survey in 1987 yielded similar results (SEIU 1995). In the United States, extensive media coverage of the harassment of women who had “intruded” into jobs and workplaces traditionally filled by males, and the notoriety given to the involvement of prominent political and public figures in alleged harassment, have resulted in an increase in the number of complaints received by state and federal anti-discrimination agencies and the number of civil law suits filed.
Working in health care and social services
In addition to the attempted robberies as noted above, health care staff are often targets of violence from anxious and disturbed patients, especially in emergency and outpatient departments, where long waits and impersonal procedures are not uncommon and where anxiety and anger may boil over into verbal or physical assaults. They may also be victims of assault by family members or friends of patients who had unfavourable outcomes which they rightly or wrongfully attribute to denials, delays or errors in treatment. In such instances they may attack the particular health worker(s) whom they hold responsible, or the violence may be aimed randomly at any staff member(s) of the medical facility.
Effects of Violence on the Victim
The trauma caused by physical assault varies with the nature of the attack and the weapons employed. Bruises and cuts on the hands and forearms are common when the victim has tried to defend himself or herself. Since the face and head are frequent targets, bruises and fractures of the facial bones are common; these can be traumatic psychologically because the swelling and ecchymoses are so visible and may take weeks to disappear (Mezey and Shepherd 1994).
The psychological effects may be more troublesome than the physical trauma, especially when a health worker has been assaulted by a patient. The victims may experience a loss of composure and self-confidence in their professional competence accompanied by a sense of guilt at having provoked the attack or having failed to detect that it was coming. Unfocused or directed anger may persist at the apparent rejection of their well-intended professional efforts, and there may be a persistent loss of confidence in themselves as well as a lack of trust in their co-workers and supervisors that can interfere with work performance. All this may be accompanied by insomnia, nightmares, diminished or increased appetite, increased consumption of tobacco, alcohol and/or drugs, social withdrawal and absenteeism from the job (Mezey and Shepherd 1994).
Post-traumatic stress disorder is a specific psychological syndrome (PTSD) that may develop after major disasters and instances of violent assault, not only in those directly involved in the incident but also in those who have witnessed it. While usually associated with life-threatening or fatal incidents, PTSD may occur after relatively trivial attacks that are perceived as life-threatening (Foa and Rothbaum 1992). The symptoms include: re-experiencing the incident through recurrent and intrusive recollections (“flashbacks”) and nightmares, persistent feelings of arousal and anxiety including muscular tension, autonomic hyperactivity, loss of concentration, and exaggerated reactivity. There is often conscious or unconscious avoidance of circumstances that recall the incident. There may be a long period of disability but the symptoms usually respond to supportive psychotherapy. They can often be prevented by a post-incident debriefing conducted as soon as possible after the incident, followed, when needed, by short-term counselling (Foa and Rothbaum 1992).
After the Incident
Interventive measures to be taken immediately after the incident include:
Care of the victim
Appropriate first-aid and medical care should be provided as quickly as possible to all injured individuals. For possible medico-legal purposes (e.g., criminal or civil actions against the assailant) the injuries should be described in detail and, if possible, photographed.
Clean-up of the workplace
Any damage or debris in the workplace should be cleaned up, and any equipment that was involved should be checked to make sure that the safety and cleanliness of the workplace have been fully restored (SEIU 1995).
Post-incident debriefing
As soon as possible, all those involved in or witnessing the incident should participate in a post-incident debriefing or a “trauma-crisis counselling” session conducted by an appropriately qualified staff member or an outside consultant. This will not only provide emotional support and identify those for whom referral for one-on-one counselling may be advisable, but also enable the collection of details of exactly what has happened. Where necessary, the counselling may be supplemented by the formation of a peer support group (CAL/OSHA 1995).
Reporting
A standardized report form should be completed and submitted to the proper individual in the organization and, when appropriate, to the police in the community. A number of sample forms that may be adapted to the needs of a particular organization have been designed and published (Unison 1991, MSF 1993, SEIU 1995). Aggregating and analysing incident report forms will provide epidemiological information that may identify risk factors for violence in the particular workplace and point the way to suitable preventive interventions.
Investigating the incident
Each reported incident of alleged violence, however trivial it may seem, should be investigated by a designated properly trained individual. (Assignment for such investigations may be made by the joint labour/management safety and health committee, where one exists.) The investigation should be aimed at identifying the cause(s) of the incident, the person(s) involved, what, if any, disciplinary measures should be invoked, and what may be done to prevent recurrences. Failure to conduct an impartial and effective investigation is a signal of management’s disinterest and a lack of concern for employees’ health and welfare.
Employer support
Victims and observers of the incident should be assured that they will not be subject to discrimination or any other form of reprisal for reporting it. This is especially important when the alleged assailant is the worker’s superior.
Depending on the regulations extant in the particular jurisdiction, the nature and extent of any injuries, and the duration of any absence from work, the employee may be eligible for workers’ compensation benefits. In such cases, the appropriate claim forms should be filed promptly.
When appropriate, a report should be filed with the local law enforcement agency. When needed, the victim may be provided with legal advice on pressing charges against the assailant, and assistance in dealing with the media.
Union Involvement
A number of unions have been playing a prominent role in dealing with workplace violence, most notably those representing workers in the health care and service industries, such as the Service Employees International Union (SEIU) in the United States, and Management, Science and Finance (MSF) and Unison in the UK. Through the development of guidelines and the publication of fact sheets, bulletins and pamphlets, they have focused on the education of workers, their representatives and their employers about the importance of violence in the workplace, how to deal with it, and how to prevent it. They have acted as advocates for members who have been victims to ensure that their complaints and allegations of violence are given appropriate consideration without threats of reprisal, and that they receive all of the benefits to which they may be entitled. Unions also advocate with employers’ and trade associations and government agencies on behalf of policies, rules and regulations intended to reduce the prevalence of violence in the workplace.
Threats of Violence
All threats of violence should be taken seriously, whether aimed at particular individuals or at the organization as a whole. First, steps must be taken to protect the targeted individual(s). Then, where possible, the assailant should be identified. If that person is not in the workforce, the local law enforcement agencies should be notified. If he or she is in the organization, it may be desirable to consult a qualified mental health professional to guide the handling of the situation and/or deal directly with the assailant.
Preventive Strategies
Preventing violence in the workplace is fundamentally the employer’s responsibility. Ideally, a formal policy and programme will have been developed and implemented before victimization occurs. This is a process that should involve not only the appropriate individuals in human resources/personnel, security, legal affairs, and employee health and safety departments, but also line managers and shop stewards or other employee representatives. A number of guides for such an exercise have been published (see table 4). They are generic and are intended to be tailored to the circumstances of a particular workplace or industry. Their common denominators include:
Table 4. Guides for programmes to prevent workplace violence
|
Date |
Title |
Source |
|
1991 |
Violence in the Workplace: |
Unison Health Care |
|
1993 |
CAL/OSHA Guidelines for Security |
Division of Occupational Safety and Health |
|
1993 |
Prevention of Violence at Work: |
MSF Health and Safety Office |
|
1995 |
Assault on the Job: We Can Do |
Service Employees International Union |
|
1995 |
CAL/OSHA: Model Injury and |
Division of Occupational Safety and Health |
|
1996 |
Guidelines for Preventing Work- |
OSHA Publications Office |
Establishing a policy
A policy explicitly outlawing discriminatory and abusive behaviour and the use of violence for dispute resolution, accompanied by specified disciplinary measures for infractions (up to and including dismissal), should be formulated and published.
Risk assessment
An inspection of the workplace, supplemented by analysis of prior incidents and/or information from employee surveys, will enable an expert to assess risk factors for violence and suggest preventive interventions. Examination of the prevailing style of management and supervision and the organization of work may disclose high levels of work stress that may precipitate violence. Study of interactions with clients, customers or patients may reveal features that may generate needless anxiety, frustration and anger, and precipitate violent reactions.
Workplace modifications to reduce crime
Guidance from police or private security experts may suggest changes in work procedures and in the layout and furnishing of the workplace that will make it a less attractive target for robbery attempts. In the United States, the Virginia Department of Criminal Justice has been using Crime Prevention Through Environmental Design (CPTED), a model approach developed by a consortium of the schools of architecture in the state that includes: changes in interior and exterior lighting and landscaping with particular attention to parking areas, stairwells and restrooms; making sales and waiting areas visible from the street; use of drop safes or time-release safes to hold cash; alarm systems, television monitors and other security equipment (Malcan 1993). CPTED has been successfully applied in convenience stores, banks (particularly in relation to automatic teller machines which may be accessed around the clock), schools and universities, and in the Washington, DC, Metro subway system.
In New York City, where robbery and killing of taxi drivers is relatively frequent compared to other large cities, the Taxi and Limousine Commission issued regulations that mandated the insertion of a transparent, bullet-resistant partition between the driver and passengers in the rear seat, a bullet-proof plate in the back of the driver’s seat, and an external distress signal light that could be turned on by the driver while remaining invisible to those inside the cab (NYC/TLC 1994). (There has been a spate of head and facial injuries among rear seat passengers who were not wearing seat belts and were thrown forward against the partition when the cab stopped suddenly.)
Where work involves interaction with customers or patients, employee safety may be enhanced by interposing barriers such as counters, desks or tables, transparent, shatter-proof partitions, and locked doors with shatter-proof windows (CAL/OSHA 1993). Furniture and equipment can be arranged to avoid entrapment of the employee and, where privacy is important, it should not be maintained at the expense of isolating the employee with a potentially aggressive or violent individual in a closed or secluded area.
Security systems
Every workplace should have a well-designed security system. Intrusion of strangers may be reduced by limiting entry to a designated reception area where visitors may have an identity check and receive ID badges indicating the areas to be visited. In some situations, it may be advisable to use metal detectors to identify visitors carrying concealed weapons.
Electronic alarm systems triggered by strategically located “panic buttons” can provide audible and/or visual signals that can alert co-workers to danger and summon help from a nearby security station. Such alarm systems may also be rigged to summon local police. However, they are of little use if guards and co-workers have not been trained to respond promptly and properly. Television monitors can not only provide protective surveillance but also record any incidents as they occur, and may help identify the perpetrator. Needless to say, such electronic systems are of little use unless they are maintained properly and tested at frequent intervals to ensure that they are in working order.
Two-way radios and cellular telephones can provide a measure of security for field personnel and those who are working alone. They also provide a means of reporting their location and, when necessary, summoning medical and other forms of assistance.
Work practice controls
Work practices should be reviewed periodically and modified to minimize the build-up of work stress. This involves attention to work schedules, work load, job content, and monitoring of work performance. Adequate staffing levels should be maintained in high-risk work areas both to discourage violent behaviour and to deal with it when it occurs. Adjustment of staffing levels to cope with peak flows of clients or patients will help to minimize irritating delays and crowding of work areas.
Staff training
Workers and supervisors should be trained to recognize rising tension and anger and in non-violent methods of defusing them. Training involving role-playing exercises will help employees to cope with overly aggressive or abusive individuals without being confrontational. In some situations, training employees in self-defence may be indicated, but there is the danger that this will breed a level of self-confidence that will lead them to delay or entirely neglect calling for available help.
Security guards, staff in psychiatric or penal institutions, and others likely to be involved with physically violent individuals should be trained to subdue and restrain them with minimal risk of injury to others or to themselves (SEIU 1995). However, according to Unison (1991), training can never be a substitute for good work organization and the provision of adequate security.
Employee assistance programmes
Employee assistance programmes (EAPs—also known as member assistance programmes, or MAPs, when provided by a union) can be particularly helpful in crisis situations by providing counselling and support to victims and witnesses of violent incidents, referring them to outside mental health professionals when needed, monitoring their progress and overseeing any protective arrangements intended to facilitate their return to work.
EAPs can also counsel employees whose frustration and anger might culminate in violent behaviour because they are overburdened by work-related problems or those arising from life in the family and/or in the community, whose frustration and anger might culminate in violent behaviour. When they have several such clients from a particular area of the workplace, they can (without breaching the confidentiality of personal information essential to their operation) guide managers to making desirable work modifications that will defuse the potential “powder keg” before violence erupts.
Research
Because of the seriousness and complexity of the problem and the paucity of reliable information, research is needed in the epidemiology, causation, prevention and control of violence in society in general and in the workplace. This requires a multidisciplinary effort involving (in addition to experts in occupational safety and health), mental health professionals, social workers, architects and engineers, experts in management science, lawyers, judges and experts in the criminal justice system, authorities on public policy, and others. Urgently needed are expanded and improved systems for the collection and analysis of the relevant data and the development of a consensus on a taxonomy of violence so that information and ideas can be more easily transposed from one discipline to others.
Conclusion
Violence is endemic in the workplace. Homicides are a major cause of work-related deaths, but their impact and cost are considerably outweighed by the prevalence of near misses, non-fatal physical assaults, threats, harassment, aggressive behaviour and abuse, much of which remains undocumented and unreported. Although most of the homicides and many of the assaults occur in conjunction with criminal activities, workplace violence is not just a criminal justice problem. Nor is it solely a problem for mental health professionals and specialists in addictions, although much of it is associated with mental illness, alcoholism and drug abuse. It requires a coordinated effort by experts in a broad variety of disciplines, led by occupational health and safety professionals, and aimed at developing, validating and implementing a coherent set of strategies for intervention and prevention, keeping in mind that the diversity in workers, jobs and industries dictates an ability to tailor them to the unique characteristics of a particular workforce and the organization that employs it.
Overview
New information technologies are being introduced in all industrial sectors, albeit to varying extents. In some cases, the costs of computerizing production processes may constitute an impediment to innovation, particularly in small and medium-sized companies and in developing countries. Computers make possible the rapid collection, storage, processing and dissemination of large quantities of information. Their utility is further enhanced by their integration into computer networks, which allow resources to be shared (Young 1993).
Computerization exerts significant effects on the nature of employment and on working conditions. Beginning about the mid-1980s, it was recognized that workplace computerization may lead to changes in task structure and work organization, and by extension to work requirements, career planning and stress suffered by production and management personnel. Computerization may exert positive or negative effects on occupational health and safety. In some cases, the introduction of computers has rendered work more interesting and resulted in improvements in the work environment and reductions of workload. In others, however, the result of technological innovation has been an increase in the repetitive nature and intensity of tasks, a reduction of the margin for individual initiative and the isolation of the worker. Furthermore, several companies have been reported to increase the number of work shifts in an attempt to extract the largest possible economic benefit from their financial investment (ILO 1984).
As far as we have been able to determine, as of 1994 statistics on the worldwide use of computers are available from one source only—The Computer Industry Almanac (Juliussen and Petska-Juliussen 1994). In addition to statistics on the current international distribution of computer use, this publication also reports the results of retrospective and prospective analyses. The figures reported in the latest edition indicate that the number of computers is increasing exponentially, with the increase becoming particularly marked at the beginning of the 1980s, the point at which personal computers began to attain great popularity. Since 1987, total computer processing power, measured in terms of the number of million instructions per second executed (MIPS) has increased 14-fold, thanks to the development of new microprocessors (transistor components of microcomputers which perform arithmetical and logical calculations). By the end of 1993, total computing power attained 357 million MIPS.
Unfortunately, available statistics do not differentiate between computers used for work and personal purposes, and statistics are unavailable for some industrial sectors. These knowledge gaps are most likely due to methodological problems related to the collection of valid and reliable data. However, reports of the International Labour Organization’s tripartite sectoral committees contain relevant and comprehensive information on the nature and extent of the penetration of new technologies in various industrial sectors.
In 1986, 66 million computers were in use throughout the world. Three years later, there were more than 100 million, and by 1997, it is estimated that 275–300 million computers will be in use, with this number reaching 400 million by 2000. These predictions assume the widespread adoption of multimedia, information highway, voice recognition and virtual reality technologies. The Almanac’s authors consider that most televisions will be equipped with personal computers within ten years of publication, in order to simplify access to the information highway.
According to the Almanac, in 1993 the overall computer: population ratio in 43 countries in 5 continents was 3.1 per 100. It should however be noted that South Africa was the only African country reporting and that Mexico was the only Central American country reporting. As the statistics indicate, there is a very wide international variation in the extent of computerization, the computer:population ratio ranging from 0.07 per 100 to 28.7 per 100.
The computer:population ratio of less than 1 per 100 in developing countries reflects the generally low level of computerization prevailing there (table 1) (Juliussen and Petska-Juliussen 1994). Not only do these countries produce few computers and little software, but lack of financial resources may in some cases prevent them from importing these products. Moreover, their often rudimentary telephone and electrical utilities are often barriers to more widespread computer use. Finally, little linguistically and culturally appropriate software is available, and training in computer-related fields is often problematic (Young 1993).
Table 1. Distribution of computers in various regions of the world
|
REGION |
COMPUTERS PER 100 PEOPLE |
|
NORTH AMERICA |
|
|
United States |
28.7 |
|
Canada |
8.8 |
|
CENTRAL AMERICA |
|
|
Mexico |
1.7 |
|
SOUTH AMERICA |
|
|
Argentina |
1.3 |
|
Brazil |
0.6 |
|
Chile |
2.6 |
|
Venezuela |
1.9 |
|
WESTERN EUROPE |
|
|
Austria |
9.5 |
|
Belgium |
11.7 |
|
Denmark |
16.8 |
|
Finland |
16.7 |
|
France |
12.9 |
|
Germany |
12.8 |
|
Greece |
2.3 |
|
Ireland |
13.8 |
|
Italy |
7.4 |
|
Netherlands |
13.6 |
|
Norway |
17.3 |
|
Portugal |
4.4 |
|
Spain |
7.9 |
|
Sweden |
15 |
|
Switzerland |
14 |
|
United Kingdom |
16.2 |
|
EASTERN EUROPE |
|
|
Czech Republic |
2.2 |
|
Hungary |
2.7 |
|
Poland |
1.7 |
|
Russian Federation |
0.78 |
|
Ukraine |
0.2 |
|
OCEANIA |
|
|
Australia |
19.2 |
|
New Zealand |
14.7 |
|
AFRICA |
|
|
South Africa |
1 |
|
ASIA |
|
|
China |
0.09 |
|
India |
0.07 |
|
Indonesia |
0.17 |
|
Israel |
8.3 |
|
Japan |
9.7 |
|
Korea, Republic of |
3.7 |
|
Phillipines |
0.4 |
|
Saudi Arabia |
2.4 |
|
Singapore |
12.5 |
|
Taiwan |
7.4 |
|
Thailand |
0.9 |
|
Turkey |
0.8 |
|
Less than 1 |
1 - 5 6 - 10 11 - 15 16-20 21 - 30 |
Source: Juliussen and Petska-Juliussen 1994.
Computerization has significantly increased in the countries of the former Soviet Union since the end of the Cold War. The Russian Federation, for example, is estimated to have increased its stock of computers from 0.3 million in 1989 to 1.2 million in 1993.
The largest concentration of computers is found in the industrialized countries, especially in North America, Australia, Scandinavia and Great Britain (Juliussen and Petska-Juliussen 1994). It was principally in these countries that the first reports of visual display unit (VDU) operators’ fears regarding health risks appeared and the initial research aimed at determining the prevalence of health effects and identifying risk factors undertaken. The health problems studied fall into the following categories: visual and ocular problems, musculoskeletal problems, skin problems, reproductive problems, and stress.
It soon became evident that the health effects observed among VDU operators were dependent not only on screen characteristics and workstation layout, but also on the nature and structure of tasks, organization of work and manner in which the technology was introduced (ILO 1989). Several studies have reported a higher prevalence of symptoms among female VDU operators than among male operators. According to recent studies, this difference is more reflective of the fact that female operators typically have less control over their work than do their male counterparts than of true biological differences. This lack of control is thought to result in higher stress levels, which in turn result in increased symptom prevalence in female VDU operators.
VDUs were first introduced on a widespread basis in the tertiary sector, where they were used essentially for office work, more specifically data entry and word processing. We should not therefore be surprised that most studies of VDUs have focused on office workers. In industrialized countries, however, computerization has spread to the primary and secondary sectors. In addition, although VDUs were used almost exclusively by production workers, they have now penetrated to all organizational levels. In recent years, researchers have therefore begun to study a wider range of VDU users, in an attempt to overcome the lack of adequate scientific information on these situations.
Most computerized workstations are equipped with a VDU and a keyboard or mouse with which to transmit information and instructions to the computer. Software mediates information exchange between the operator and the computer and defines the format with which information is displayed on the screen. In order to establish the potential hazards associated with VDU use, it is first necessary to understand not only the characteristics of the VDU but also those of the other components of the work environment. In 1979, Çakir, Hart and Stewart published the first comprehensive analysis in this field.
It is useful to visualize the hardware used by VDU operators as nested components that interact with each other (IRSST 1984). These components include the terminal itself, the workstation (including work tools and furniture), the room in which the work is carried out, and the lighting. The second article in this chapter reviews the main characteristics of workstations and their lighting. Several recommendations aimed at optimizing working conditions while taking into account individual variations and variations in tasks and work organization are offered. Appropriate emphasis is placed on the importance of choosing equipment and furniture which allow flexible layouts. This flexibility is extremely important in light of international competition and rapidly evolving technological development that are constantly driving companies to introduce innovations and while simultaneously forcing them to adapt to the changes these innovations bring.
The next six articles discuss health problems studied in response to fears expressed by VDU operators. The relevant scientific literature is reviewed and the value and limitations of research results highlighted. Research in this field draws upon numerous disciplines, including epidemiology, ergonomics, medicine, engineering, psychology, physics and sociology. Given the complexity of the problems and more specifically their multifactorial nature, the necessary research has often been conducted by multidisciplinary research teams. Since the 1980s, these research efforts have been complemented by regularly organized international congresses such as Human-Computer Interaction and Work with Display Units, which provide an opportunity to disseminate research results and promote the exchange of information between researchers, VDU designers, VDU producers and VDU users.
The eighth article discusses human-computer interaction specifically. The principles and methods underlying the development and evaluation of interface tools are presented. This article will prove useful not only to production personnel but also those interested in the criteria used to select interface tools.
Finally, the ninth article reviews international ergonomic standards as of 1995, related to the design and layout of computerized workstations. These standards have been produced in order to eliminate the hazards to which VDU operators can be exposed in the course of their work. The standards provide guidelines to companies producing VDU components, employers responsible for the purchase and layout of workstations, and employees with decision-making responsibilities. They may also prove useful as tools with which to evaluate existing workstations and identify modifications required in order to optimize operators’ working conditions.
Characteristics of Visual Display Workstations
Workstation Design
On workstations with visual display units
Visual displays with electronically generated images (visual display units or VDUs) represent the most characteristic element of computerized work equipment both in the workplace and in private life. A workstation may be designed to accommodate just a VDU and an input device (normally a keyboard), as a minimum; however, it can also provide room for diverse technical equipment including numerous screens, input and output devices, etc. As recently as the early 1980s, data entry was the most typical task for computer users. In many industrialized countries, however, this type of work is now performed by a relatively small number of users. More and more, journalists, managers and even executives have become “VDU users”.
Most VDU workstations are designed for sedentary work, but working in standing postures may offer some benefits for the users. Thus, there is some need for generic design guidelines applicable to simple and complex workstations used both while sitting and standing. Such guidelines will be formulated below and then applied to some typical workplaces.
Design guidelines
Workplace design and equipment selection should consider not only the needs of the actual user for a given task and the variability of users’ tasks during the relatively long life cycle of furniture (lasting 15 years or longer), but also factors related to maintenance or change of equipment. ISO Standard 9241, part 5, introduces four guiding principles to be applied to workstation design:
Guideline 1: Versatility and flexibility.
A workstation should enable its user to perform a range of tasks comfortably and efficiently. This guideline takes into account the fact that users’ tasks may vary often; thus, the chance of a universal adoption of guidelines for the workplace will be small.
Guideline 2: Fit.
The design of a workstation and its components should ensure a “fit” to be achieved for a variety of users and a range of task requirements. The concept of fit concerns the extent to which furniture and equipment can accommodate an individual user’s various needs, that is, to remain comfortable, free from visual discomfort and postural strain. If not designed for a specific user population, e.g., male European control room operators younger than 40 years of age, the workstation concept should ensure fit for the entire working population including users with special needs, e.g., handicapped persons. Most existing standards for furniture or the design of workplaces take only parts of the working population into consideration (e.g., “healthy” workers between the 5th and 95th percentile, aged between 16 and 60, as in German standard DIN 33 402), neglecting those who may need more attention.
Moreover, though some design practices are still based on the idea of an “average” user, an emphasis on individual fit is needed. With regard to workstation furniture, the fit required may be achieved by providing adjustability, designing a range of sizes, or even by custom-made equipment. Ensuring a good fit is crucial for the health and safety of the individual user, since musculoskeletal problems associated with the use of VDUs are common and significant.
Guideline 3: Postural change.
The design of the workstation should encourage movement, since static muscular load leads to fatigue and discomfort and may induce chronic musculoskeletal problems. A chair that allows easy movement of the upper half of the body, and provision of sufficient space to place and use paper documents as well as keyboards at varying positions during the day, are typical strategies for facilitating body movement while working with a VDU.
Guideline 4: Maintainability—adaptability.
The design of the workstation should take into consideration factors such as maintenance, accessibility, and the ability of the workplace to adapt to changing requirements, such as the ability to move the work equipment if a different task is to be performed. The objectives of this guideline have not received much attention in the ergonomics literature, because problems related to them are assumed to have been solved before users start to work at a workstation. In reality, however, a workstation is an ever-changing environment, and cluttered workspaces, partly or fully unsuitable for the tasks at hand, are very often not the result of their initial design process but are the outcome of later changes.
Applying the guidelines
Task analysis.
Workplace design should be preceded by a task analysis, which provides information about the primary tasks to be performed at the workstation and the equipment needed for them. In such an analysis, the priority given to information sources (e.g., paper-based documents, VDUs, input devices), the frequency of their use and possible restrictions (e.g., limited space) should be determined. The analysis should include major tasks and their relationships in space and time, visual attention areas (how many visual objects are to be used?) and the position and use of the hands (writing, typing, pointing?).
General design recommendations
Height of the work surfaces.
If fixed-height work surfaces are to be used, the minimum clearance between the floor and the surface should be greater than the sum of the popliteal height (the distance between the floor and the back of the knee) and thigh clearance height (sitting), plus allowance for footwear (25 mm for male users and 45 mm for female users). If the workstation is designed for general use, the popliteal height and thigh clearance height should be selected for the 95th percentile male population. The resulting height for the clearance under the desk surface is 690 mm for the population of Northern Europe and for North American users of European origin. For other populations, the minimum clearance needed is to be determined according to the anthropometric characteristics of the specific population.
If the legroom height is selected this way, the top of the work surfaces will be too high for a large proportion of intended users, and at least 30 per cent of them will need a footrest.
If work surfaces are adjustable in height, the required range for adjustment can be calculated from the anthropometric dimensions of female users (5th or 2.5th percentile for minimum height) and male users (95th or 97.5th percentile for maximum height). A workstation with these dimensions will in general be able to accommodate a large proportion of persons with little or no change. The result of such a calculation yields a range between 600 mm to 800 mm for countries with an ethnically varied user population. Since the technical realization of this range may cause some mechanical problems, best fit can also be achieved, for example, by combining adjustability with different size equipment.
The minimum acceptable thickness of the work surface depends on the mechanical properties of the material. From a technical point of view, a thickness between 14 mm (durable plastic or metal) and 30 mm (wood) is achievable.
Size and form of the work surface.
The size and the form of a work surface are mainly determined by the tasks to be performed and the equipment needed for those tasks.
For data entry tasks, a rectangular surface of 800 mm by 1200 mm provides sufficient space to place the equipment (VDU, keyboard, source documents and copy holder) properly and to rearrange the layout according to personal needs. More complex tasks may require additional space. Therefore, the size of the work surface should exceed 800 mm by 1,600 mm. The depth of the surface should allow placing the VDU within the surface, which means that VDUs with cathode ray tubes may require a depth of up to 1,000 mm.
In principle, the layout displayed in figure 1 gives maximum flexibility for organizing the workspace for various tasks. However, workstations with this layout are not easy to construct. Thus, the best approximation of the ideal layout is as displayed in figure 2. This layout allows arrangements with one or two VDUs, additional input devices and so on. The minimum area of the work surface should be larger than 1.3 m2.
Figure 1. Layout of a flexible workstation that can be adapted to fit the needs of users with different tasks
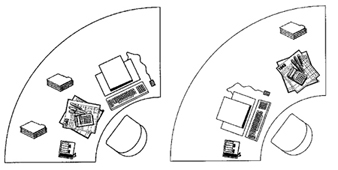
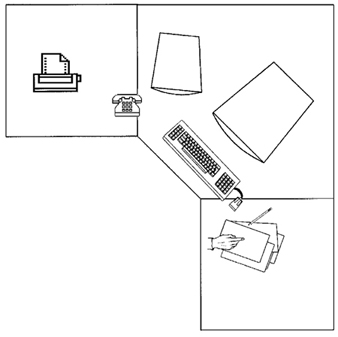
Arranging the workspace.
The spatial distribution of equipment in the workspace should be planned after a task analysis determining the importance and use frequency of each element has been conducted (table 1). The most frequently used visual display should be located within the central visual space, which is the shaded area of figure 3, while the most important and frequently used controls (such as the keyboard) should be located within optimum reach. In the workplace represented by the task analysis (table 1), the keyboard and the mouse are by far the most frequently handled pieces of equipment. Therefore, they should be given the highest priority within the reach area. Documents which are frequently consulted but do not need much handling should be assigned priority according to their importance (e.g., handwritten corrections). Placing them on the right-hand side of the keyboard would solve the problem, but this would create a conflict with the frequent use of the mouse which is also to be located to the right of the keyboard. Since the VDU may not need adjustment frequently, it can be placed to the right or left of the central field of vision, allowing the documents to be set on a flat document holder behind the keyboard. This is one possible, though not perfect, “optimized” solution.
Table 1. Frequency and importance of elements of equipment for a given task
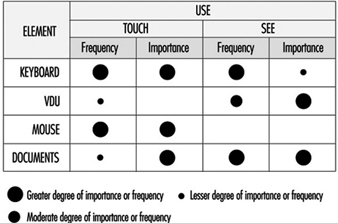
Figure 3. Visual workplace range
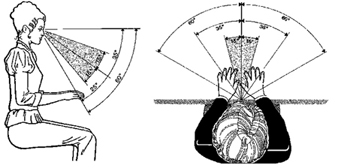
Since many elements of the equipment possess dimensions comparable to corresponding parts of the human body, using various elements within one task will always be associated with some problems. It also may require some movements between parts of the workstation; hence a layout like that shown in figure 1 is important for various tasks.
In the course of the last two decades, computer power that would have needed a ballroom at the beginning was successfully miniaturized and condensed into a simple box. However, contrary to the hopes of many practitioners that miniaturization of equipment would solve most problems associated with workplace layout, VDUs have continued to grow: in 1975, the most common screen size was 15"; in 1995 people bought 17" to 21”:monitors, and no keyboard has become much smaller than those designed in 1973. Carefully performed task analyses for designing complex workstations are still of growing importance. Moreover, although new input devices have emerged, they have not replaced the keyboard, and require even more space on the work surface, sometimes of substantial dimensions, e.g., graphic tablets in an A3-format.
Efficient space management within the limits of a workstation, as well as within work rooms, may help in developing acceptable workstations from an ergonomic point of view, thus preventing the emergence of various health and safety problems.
Efficient space management does not mean saving space at the expense of the usability of input devices and especially vision. Using extra furniture, such as a desk return, or a special monitor-holder clamped to the desk, may appear to be a good way to save desk space; however, it may be detrimental to posture (raised arms) and vision (raising the line of vision upwards from the relaxed position). Space-saving strategies should ensure that an adequate visual distance (approximately 600 mm to 800 mm) is maintained, as well as an optimum line-of-vision, obtained from an inclination of approximately 35º from the horizontal (20º head and 15º eyes).
New furniture concepts.
Traditionally, office furniture was adapted to the needs of businesses, supposedly reflecting the hierarchy of such organizations: large desks for executives working in “ceremonial” offices at one end of the scale, and small typists furniture for “functional” offices at the other. The basic design of office furniture did not change for decades. The situation changed substantially with the introduction of information technology, and a completely new furniture concept has emerged: that of systems furniture.
Systems furniture was developed when people realized that changes in working equipment and work organization could not be matched by the limited capabilities of existing furniture to adapt to new needs. Furniture today offers a tool-box that enables the user organizations to create workspace as needed, from a minimal space for just a VDU and a keyboard up to complex workstations that can accommodate various elements of equipment and possibly also groups of users. Such furniture is designed for change and incorporates efficient and flexible cable management facilities. While the first generation of systems furniture did not do much more than add an auxiliary desk for the VDU to an existing desk, the third generation has completely broken its ties to the traditional office. This new approach offers great flexibility in designing workspaces, limited only by the available space and the abilities of organizations to use this flexibility.
Radiation
Radiation in the context of VDU applications
Radiation is the emission or transfer of radiant energy. The emission of radiant energy in the form of light as the intended purpose for the use of VDUs may be accompanied by various unwanted by-products such as heat, sound, infrared and ultraviolet radiation, radio waves or x rays, to name a few. While some forms of radiation, like visible light, may affect humans in a positive way, some emissions of energy can have negative or even destructive biological effects, especially when the intensity is high and the duration of exposure is long. Some decades ago exposure limits for different forms of radiation were introduced to protect people. However, some of these exposure limits are questioned today, and, for low frequency alternating magnetic fields, no exposure limit can be given based on levels of natural background radiation.
Radiofrequency and microwave radiation from VDUs
Electromagnetic radiation with a frequency range from a few kHz to 109 Hertz (the so-called radiofrequency, or RF, band, with wavelengths ranging from some km to 30 cm) can be emitted by VDUs; however, the total energy emitted depends on the characteristics of the circuitry. In practice, however, the field strength of this type of radiation is likely to be small and confined to the immediate vicinity of the source. A comparison of the strength of alternating electric fields in the range of 20 Hz to 400 kHz indicates that VDUs using cathode ray tube (CRT) technology emit, in general, higher levels than other displays.
“Microwave” radiation covers the region between 3x10⁸ Hz to 3x10¹¹ Hz (wavelengths 100 cm to 1 mm). There are no sources of microwave radiation in VDUs that emit a detectable amount of energy within this band.
Magnetic fields
Magnetic fields from a VDU originate from the same sources as alternating electric fields. Although magnetic fields are not “radiation”, alternating electric and magnetic fields cannot be separated in practice, since one induces the other. One reason why magnetic fields are discussed separately is that they are suspected to have teratogenic effects (see discussion later in this chapter).
Although the fields induced by VDUs are weaker than those induced by some other sources, such as high-voltage power lines, power plants, electrical locomotives, steel ovens and welding equipment, the total exposure produced by VDUs may be similar since people may work eight or more hours in the vicinity of a VDU but seldom near power lines or electric motors. The question of the relationship between electromagnetic fields and cancer, however, is still a matter for debate.
Optical radiation
“Optical” radiation covers visible radiation (i.e., light) with wavelengths from 380 nm (blue) to 780 nm (red), and the neighbouring bands in the electromagnetic spectrum (infrared from 3x10¹¹ Hz to 4x10¹⁴ Hz, wavelengths from 780 nm to 1 mm; ultraviolet from 8x10¹⁴ Hz to 3x10¹⁷ Hz). Visible radiation is emitted at moderate levels of intensity comparable with that emitted by room surfaces (»100 cd/m2). However, ultraviolet radiation is trapped by the glass of the tube face (CRTs) or not emitted at all (other display technologies). Levels of ultraviolet radiation, if detectable at all, stay well below occupational exposure standards, as do those of infrared radiation.
X rays
CRTs are well-known sources of x rays, while other technologies like liquid crystal displays (LCDs) do not emit any. The physical processes behind emissions of this type of radiation are well understood, and tubes and circuitry are designed to keep the emitted levels far below the occupational exposure limits, if not below detectable levels. Radiation emitted by a source can only be detected if its level exceeds the background level. In the case of x rays, as for other ionizing radiation, the background level is provided by cosmic radiation and by radiation from radioactive materials in the ground and in buildings. In normal operation, a VDU does not emit x rays exceeding the background level of radiation (50 nGy/h).
Radiation recommendations
In Sweden, the former MPR (Statens Mät och Provråd, the National Council for Metrology and Testing) organization, now SWEDAC, has worked out recommendations for evaluating VDUs. One of their main objectives was to limit any unwanted by-product to levels that can be achieved by reasonable technical means. This approach goes beyond the classical approach of limiting hazardous exposures to levels where the likelihood of an impairment of health and safety seems to be acceptably low.
At the beginning, some recommendations of MPR led to the unwanted effect of reducing the optical quality of CRT displays. However, at present, only very few products with extremely high resolution may suffer any degradation if the manufacturer attempts to comply with the MPR (now MPR-II). The recommendations include limits for static electricity, magnetic and electric alternating fields, visual parameters, etc.
Image Quality
Definitions for image quality
The term quality describes the fit of distinguishing attributes of an object for a defined purpose. Thus, the image quality of a display includes all properties of the optical representation regarding the perceptibility of symbols in general, and the legibility or readability of alphanumeric symbols. In this sense, optical terms used by tube manufacturers, like resolution or minimum spot size, describe basic quality criteria concerning the abilities of a given device for displaying thin lines or small characters. Such quality criteria are comparable with the thickness of a pencil or brush for a given task in writing or painting.
Some of the quality criteria used by ergonomists describe optical properties that are relevant for legibility, e.g., contrast, while others, like character size or stroke width, refer more to typographical features. In addition, some technology-dependent features like the flicker of images, the persistence of images, or the uniformity of contrast within a given display are also considered in ergonomics (see figure 4).
Figure 4. Criteria for image evaluation
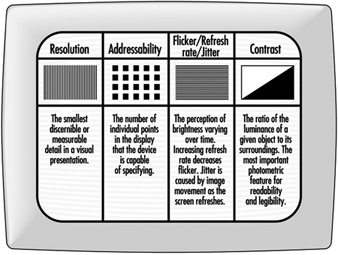
Typography is the art of composing “type”, which is not only shaping the fonts, but also selecting and setting of type. Here, the term typography is used in the first meaning.
Basic characteristics
Resolution.
Resolution is defined as the smallest discernible or measurable detail in a visual presentation. For example, the resolution of a CRT display can be expressed by the maximum number of lines that can be displayed in a given space, as usually done with the resolution of photographic films. One can also describe the minimum spot size that a device can display at a given luminance (brightness). The smaller the minimum spot, the better the device. Thus, the number of dots of minimum size (picture elements—also known as pixels) per inch (dpi) represents the quality of the device, e.g., a 72 dpi device is inferior to a 200 dpi display.
In general, the resolution of most computer displays is well below 100 dpi: some graphic displays may achieve 150 dpi, however, only with limited brightness. This means, if a high contrast is required, the resolution will be lower. Compared with the resolution of print, e.g., 300 dpi or 600 dpi for laser printers, the quality of VDUs is inferior. (An image with 300 dpi has 9 times more elements in the same space than a 100 dpi image.)
Addressability.
Addressability describes the number of individual points in the field that the device is capable of specifying. Addressability, which is very often confused with resolution (sometimes deliberately), is one specification given for devices: “800 x 600” means that the graphic board can address 800 points on every one of 600 horizontal lines. Since one needs at least 15 elements in the vertical direction to write numbers, letters and other characters with ascenders and descenders, such a screen can display a maximum of 40 lines of text. Today, the best available screens can address 1,600 x 1,200 points; however, most displays used in industry address 800 x 600 points or even less.
On displays of the so-called “character-oriented” devices, it is not dots (points) of the screen that are addressed but character boxes. In most such devices, there are 25 lines with 80 character positions each in the display. On these screens, each symbol occupies the same space regardless of its width. In industry the lowest number of pixels in a box is 5 wide by 7 high. This box allows both upper and lower case characters, although the descenders in “p”, “q” and “g”, and the ascenders above “Ä” or “Á” cannot be displayed. Considerably better quality is provided with the 7 x 9 box, which has been “standard” since the mid-1980s. To achieve good legibility and reasonably good character shapes, the character box size should be at least 12 x 16.
Flicker and refresh rate.
The images on CRTs and on some other types of VDU are not persistent images, as on paper. They only appear to be steady by taking advantage of an artefact of the eye. This, however, is not without penalty, since the screen tends to flicker if the image is not refreshed constantly. Flicker can influence both performance and comfort of the user and should always be avoided.
Flicker is the perception of brightness varying over time. The severity of flicker depends on various factors such as the characteristics of the phosphor, size and brightness of the flickering image, etc. Recent research shows that refresh rates up to 90 Hz may be needed to satisfy 99 per cent of users, while in earlier research, refresh rates well below 50 Hz were thought to be satisfactory. Depending on various features of the display, a flicker-free image may be achieved by refresh rates between 70 Hz and 90 Hz; displays with a light background (positive polarity) need a minimum of 80 Hz to be perceived as flicker-free.
Some modern devices offer an adjustable refresh rate; unfortunately, higher refresh rates are coupled with lower resolution or addressability. The ability of a device to display high “resolution” images with high refresh rates can be assessed by its video bandwidth. For displays with high quality, the maximum video bandwidth lies above 150 MHz, while some displays offer less than 40 MHz.
To achieve a flicker-free image and a high resolution with devices with lower video bandwidth, the manufacturers apply a trick that stems from commercial TV: the interlace mode. In this case, every second line on the display is refreshed with a given frequency. The result, however, is not satisfactory if static images, such as text and graphics, are displayed and the refresh rate is below 2 x 45 Hz. Unfortunately, the attempt to suppress the disturbing effect of flicker may induce some other negative effects.
Jitter.
Jitter is the result of spatial instability of the image; a given picture element is not displayed at the same location on the screen after each refresh process. The perception of jitter cannot be separated from the perception of flicker.
Jitter may have its cause in the VDU itself, but it can also be induced by interaction with other equipment at the workplace, such as a printer or other VDUs or devices that generate magnetic fields.
Contrast.
Brightness contrast, the ratio of the luminance of a given object to its surroundings, represents the most important photometric feature for readability and legibility. While most standards require a minimum ratio of 3:1 (bright characters on dark background) or 1:3 (dark characters on bright background), optimum contrast is actually about 10:1, and devices of good quality achieve higher values even in bright environments.
The contrast of “active” displays is impaired when the ambient light is increased, while “passive” displays (e.g., LCDs) lose contrast in dark environments. Passive displays with background lighting may offer good visibility in all environments under which people may work.
Sharpness.
Sharpness of an image is a well-known, but still ill-defined feature. Hence, there is no agreed-upon method to measure sharpness as a relevant feature for legibility and readability.
Typographical features
Legibility and readability.
Readability refers to whether a text is understandable as a series of connected images, while legibility refers to the perception of single or grouped characters. Thus, good legibility is, in general, a precondition for readability.
Legibility of text depends on several factors: some have been investigated thoroughly, while other relevant factors like character shapes are yet to be classified. One of the reasons for this is that the human eye represents a very powerful and robust instrument, and the measures used for performance and error rates often do not help to distinguish between different fonts. Thus, to some extent, typography still remains an art rather than a science.
Fonts and readability.
A font is a family of characters, designed to yield either optimum readability on a given medium, e.g., paper, electronic display or projection display, or some desired aesthetic quality, or both. While the number of available fonts exceeds ten thousand, only a few fonts, numbered in tens, are believed to be “readable”. Since legibility and readability of a font are also affected by the experience of the reader—some “legible” fonts are believed to have become so because of decades or even centuries of use without changing their shape—the same font may be less legible on a screen than on paper, merely because its characters look “new”. This, however, is not the main reason for the poor legibility of screens.
In general, the design of screen fonts is restricted by shortcomings in technology. Some technologies impose very narrow limits on the design of characters, e.g., LEDs or other rastered screens with limited numbers of dots per display. Even the best CRT displays can seldom compete with print (figure 5). In the last years, research has shown that speed and accuracy of reading on screens is about 30% lower than on paper, but whether this is due to features of the display or to other factors is not yet known.
Figure 5. Appearance of a letter at various screen resolutions and on paper (right)

Characteristics with measurable effects.
The effects of some characteristics of alphanumeric representations are measurable, e.g., apparent size of the characters, height/width ratio, stroke width/size ratio, line, word and character spacing.
The apparent size of the characters, measured in minutes of arc, shows an optimum by 20' to 22'; this corresponds to about 3 mm to 3.3 mm in height under normal viewing conditions in offices. Smaller characters may lead to increased errors, visual strain, and also to more postural strain due to restricted viewing distance. Thus, text should not be represented in an apparent size of less than 16'.
However, graphical representations may require text of smaller size to be displayed. To avoid errors, on the one hand, and a high visual load for the user on the other, parts of the text to be edited should be displayed in a separate window to assure good readability. Characters with an apparent size of less than 12' should not be displayed as readable text, but replaced by a rectangular grey block. Good programs allow the user to select the minimum actual size of characters that are to be displayed as alphanumerics.
The optimum height/width ratio of characters is about 1:0.8; legibility is impaired if the ratio is above 1:0.5. For good legible print and also for CRT screens, the ratio of character height to stroke width is about 10:1. However, this is only a rule of thumb; legible characters of high aesthetical value often show different stroke widths (see figure 5).
Optimal line spacing is very important for readability, but also for space saving, if a given amount of information is to be displayed in limited space. The best example for this is the daily newspaper, where an enormous amount of information is displayed within a page, but is still readable. The optimum line spacing is about 20% of character height between the descenders of a line and the ascenders of the next; this is a distance of about 100% of the character height between the baseline of a line of text and the ascenders of the next. If the length of the line is reduced, the space between the lines may be reduced, too, without losing readability.
Character spacing is invariable on character-oriented screens, making them inferior in readability and aesthetic quality to displays with variable space. Proportional spacing depending on the shape and width of the characters is preferable. However, a typographical quality comparable to well-designed printed fonts is achievable only on few displays and when using specific programs.
Ambient Lighting
The specific problems of VDU workstations
During the last 90 years of industrial history, the theories about the lighting of our workplaces have been governed by the notion that more light will improve vision, reduce stress and fatigue, as well as enhance performance. “More light”, correctly speaking “more sunlight”, was the slogan of people in Hamburg, Germany, more than 60 years ago when they took to the streets to fight for better and healthier homes. In some countries like Denmark or Germany, workers today are entitled to have some daylight at their workplaces.
The advent of information technology, with the emergence of the first VDUs in working areas, was presumably the first event ever when workers and scientists began to complain about too much light in working areas. The discussion was fuelled by the easily detectable fact that most VDUs were equipped with CRTs, which have curved glass surfaces prone to veiling reflections. Such devices, sometimes called “active displays”, lose contrast when the level of ambient lighting becomes higher. Redesigning lighting to reduce the visual impairments caused by these effects, however, is complicated by the fact that most users also use paper-based information sources, which generally require increased levels of ambient light for good visibility.
The role of ambient light
Ambient light found in the vicinity of VDU workstations serves two different purposes. First, it illuminates the workspace and working materials like paper, telephones, etc. (primary effect). Secondly, it illuminates the room, giving it its visible shape and giving the users the impression of a light surrounding (secondary effect). Since most lighting installations are planned according to the concept of general lighting, the same lighting sources serve both purposes. The primary effect, illuminating passive visual objects to make them visible or legible, became questionable when people started to use active screens that do not need ambient light to be visible. The remaining benefit of the room lighting was reduced to the secondary effect, if the VDU is the major source of information.
The function of VDUs, both of CRTs (active displays) and of LCDs (passive displays), is impaired by the ambient light in specific ways:
CRTs:
- The curved glass surface reflects bright objects in the environment, and forms a kind of visual “noise”.
- Depending on the intensity of ambient illumination, the contrast of displayed objects is reduced to a degree that readability or legibility of the objects is impaired.
- Images on colour CRTs suffer a twofold degradation: First, the brightness contrast of all displayed objects is reduced, as on monochrome CRTs. Secondly, the colours are changed so that colour contrast is also reduced. In addition, the number of distinguishable colours is reduced.
LCDs (and other passive displays):
- The reflections on LCDs cause less concern than those on CRT surfaces, since these displays have flat surfaces.
- In contrast to active displays, LCDs (without backlight) lose contrast under low levels of ambient illumination.
- Due to poor directional characteristics of some display technologies, visibility or legibility of displayed objects is substantially reduced if the main direction of light incidence is unfavourable.
The extent to which such impairments exert a stress on users or lead to a substantial reduction of visibility/readability/legibility of visual objects in real working environments varies greatly. For example, the contrast of alphanumeric characters on monochrome (CRT) displays is reduced in principle, but, if the illuminance on the screen is ten times higher than in normal working environments, many screens will still have a contrast sufficient to read alphanumeric characters. On the other hand, colour displays of computer-aided design (CAD) systems decrease substantially in visibility so that most users prefer to dim the artificial lighting or even to switch it off, and, in addition, to keep the daylight out of their working area.
Possible remedies
Changing illuminance levels.
Since 1974, numerous studies have been performed which led to recommendations for reducing illuminance at the workplace. However, these recommendations were mostly based on studies with unsatisfactory screens. The recommended levels were between 100 lux and 1,000 lx, and generally, levels well below the recommendations of the existing standards for office lighting (e.g., 200 lx or 300 to 500 lx) have been discussed.
When positive screens with a luminance of approximately 100 cd/m2 brightness and some kind of efficient anti-glare treatment are used, the utilization of a VDU does not limit the acceptable illuminance level, since users find illuminance levels up to 1,500 lx acceptable, a value which is very rare in working areas.
If the relevant characteristics of the VDUs do not allow comfortable working under normal office lighting, as can occur when working with storage tubes, microimage readers, colour screens etc., the visual conditions can be improved substantially by introducing two-component lighting. Two-component lighting is a combination of indirect room lighting (secondary effect) and direct task lighting. Both components should be controllable by the users.
Controlling glare on screens.
Controlling glare on screens is a difficult task since almost all remedies that improve the visual conditions are likely to impair some other important characteristic of the display. Some remedies, proposed for many years, such as mesh filters, remove reflections from the displays but they also impair the legibility of the display. Low luminance luminaires cause less reflected glare on screens, but the quality of such lighting generally is judged by users to be worse than that of any other type of lighting.
For this reason, any measures (see figure 6) should be applied cautiously, and only after analysing the real cause of the annoyance or disturbance. Three possible ways of controlling glare on screens are: selection of the correct location of the screen with respect to glare sources; selection of suitable equipment or addition of elements to it; and use of lighting. The costs of the measures to be taken are of the same order: it costs almost nothing to place screens in such a way as to eliminate reflected glare. However, this may not be possible in all cases; thus, equipment-related measures will be more expensive but may be necessary in various working environments. Glare control by lighting is often recommended by lighting specialists; however, this method is the most expensive but not the most successful way of controlling glare.
Figure 6. Strategies for controlling glare on screens
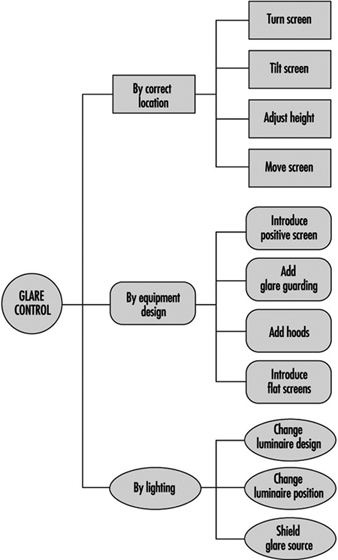
The most promising measure at present is the introduction of positive screens (displays with bright background) with an additional anti-glare treatment for the glass surface. Even more successful than this will be the introduction of flat screens with a nearly matt surface and bright background; such screens, however, are not available for general use today.
Adding hoods to displays is the ultima ratio of the ergonomists for difficult work environments like production areas, towers of airports or operator cabins of cranes, etc. If hoods are really needed, it is likely that there will be more severe problems with lighting than just reflected glare on visual displays.
Changing luminaire design is mainly accomplished in two ways: first, by reducing the luminance (corresponds to apparent brightness) of parts of the light fittings (so called “VDU lighting”), and secondly, by introducing indirect light instead of direct light. The results of current research show that introducing indirect light yields substantial improvements for users, reduces visual load, and is well accepted by users.
Ocular and Visual Problems
There have been a comparatively large number of studies devoted to visual discomfort in visual display unit (VDU) workers, many of which have yielded contradictory results. From one survey to another, there are discrepancies in reported prevalence of disorders ranging from practically 0 per cent to 80 per cent or more (Dainoff 1982). Such differences should not be considered too surprising because they reflect the large number of variables which can influence complaints of eye discomfort or disability.
Correct epidemiological studies of visual discomfort must take into account several population variables, such as sex, age, eye deficiencies, or use of lenses, as well as socio-economic status. The nature of the job being carried out with the VDU and the characteristics of the workstation layout and of the work organization are also important and many of these variables are interrelated.
Most often, questionnaires have been used to assess the eye discomfort of VDU operators. The prevalence of visual discomfort differs thus with the content of questionnaires and their statistical analysis. Appropriate questions for surveys concern the extent of symptoms of distress asthenopia suffered by VDU operators. Symptoms of this condition are well known and can include itching, redness, burning and tearing of the eyes. These symptoms are related to the fatigue of the accommodative function in the eye. Sometimes this eye symptoms are accompanied by a headache, with the pain located in the front portion of the head. There may also be disturbances in eye function, with symptoms such as double vision and reduced accommodative power. Visual acuity, itself, however, is rarely depressed, provided the conditions of measurement are carried out with a constant pupil size.
If a survey includes general questions, such as “Do you feel well at the end of the working day?” or “Have you ever had visual problems when working with VDUs?” the prevalence of positive responses may be higher than when single symptoms related to asthenopia are evaluated.
Other symptoms may also be strongly associated to asthenopia. Pains in the neck, shoulders and arms are frequently found. There are two main reasons that these symptoms may occur together with eye symptoms. The muscles of the neck participate in keeping a steady distance between eye and screen in VDU work and VDU work has two main components: screen and keyboard, which means that the shoulders and arms and the eyes are all working at the same time and thus may be subject to similar work-related strains.
User Variables Related to Visual Comfort
Sex and Age
In the majority of surveys, women report more eye discomfort than men. In one French study, for example, 35.6% of women complained of eye discomfort, against 21.8% of men (p J 05 significance level) (Dorard 1988). In another study (Sjödren and Elfstrom 1990) it was observed that while the difference in the degree of discomfort between women (41%) and men (24%) was great, it “was more pronounced for those working 5-8 hours a day than for those working 1-4 hours a day”. Such differences are not necessarily sex-related, however, since women and men seldom share similar tasks. For example, in one computer plant studied, when women and men were both occupied in a traditional “woman’s job”, both sexes displayed the same amount of visual discomfort. Furthermore when women worked in traditional “men’s jobs”, they did not report more discomfort than men. In general, regardless of sex, the number of visual complaints among skilled workers who use VDUs on their jobs is much lower than the number of complaints from workers in unskilled, hectic jobs, such as data entry or word processing (Rey and Bousquet 1989). Some of these data are given in table 1.
Table 1. Prevalence of ocular symptoms in 196 VDU operators according to 4 categories
|
Categories |
Percentage of symptoms (%) |
|
Females in "female" jobs |
81 |
|
Males in "female" jobs |
75 |
|
Males in "male" jobs |
68 |
|
Females in "male" jobs |
65 |
Source: From Dorard 1988 and Rey and Bousquet 1989.
The highest number of visual complaints usually arise in the 40–50-year-old group, probably because this is the time when changes in accommodation ability of the eye are occurring rapidly. However, although older operators are perceived as having more visual complaints than younger workers, and, as a consequence, presbyopia (vision impairment due to ageing) is often cited as the main visual defect associated with visual discomfort at VDU workstations, it is important to consider that there is also a strong association between having acquired advanced skills in VDU work and age. There is usually a higher proportion of older women among unskilled female VDU operators, and younger male workers tend to more often be employed in skilled jobs. Thus before broad generalizations about age and visual problems associated with VDU can be made, the figures should be adjusted to take into account the comparative nature and skill level of the work being done at the VDU.
Eye defects and corrective lenses
In general, about half of all VDU operators display some kind of eye deficiency and most of these people use prescriptive lenses of one type or another. Often VDU user populations do not differ from the working population as far as eye defects and eye correction are concerned. For example, one survey (Rubino 1990) conducted among Italian VDU operators revealed that roughly 46% had normal vision and 38% were nearsighted (myopic), which is consistent with figures observed among Swiss and French VDU operators (Meyer and Bousquet 1990). Estimates of the prevalence of eye defects will vary according to the assessment technique used (Çakir 1981).
Most experts believe that presbyopia itself does not appear to have a significant influence on the incidence of asthenopia (persistent tiredness of the eyes). Rather, the use of unsuitable lenses appears to be likely to induce eye fatigue and discomfort. There is some disagreement about the effects in shortsighted young persons. Rubino has observed no effect while, according to Meyer and Bousquet (1990), myopic operators readily complain of undercorrection for the distance between eye and screen (usually 70 cm). Rubino also has proposed that people who suffer from a deficiency in eye coordination may be more likely to suffer from visual complaints in VDU work.
One interesting observation that resulted from a French study involving a thorough eye examination by ophthalmologists of 275 VDU operators and 65 controls was that 32% of those examined could have their vision improved by good correction. In this study 68% had normal vision, 24% were shortsighted and 8% farsighted (Boissin et al., 1991). Thus, although industrialized countries are, in general, well equipped to provide excellent eye care, eye correction is probably either completely neglected or inappropriate for those working at a VDU. An interesting finding in this study was that more cases of conjunctivitis were found in the VDU operators (48%) than in the controls. Since conjunctivitis and poor eyesight are correlated, this implies that better eye correction is needed.
Physical and Organizational Factors Affecting Visual Comfort
It is clear that in order to assess, correct and prevent visual discomfort in VDU work an approach which takes into account the many different factors described here and elsewhere in this chapter is essential. Fatigue and eye discomfort can be the result of individual physiological difficulties in normal accommodation and convergence in the eye, from conjunctivitis, or from wearing glasses that are poorly corrected for distance. Visual discomfort can be related to the workstation itself and can also be linked to work organization factors such as monotony and time spent on the job with and without a break. Inadequate lighting, reflections on screen, flicker and too much luminance of characters can also increase the risk of eye discomfort. Figure 1 illustrates some of these points.
Figure 1. Factors that increase the risk of eye fatigue among VDU workers
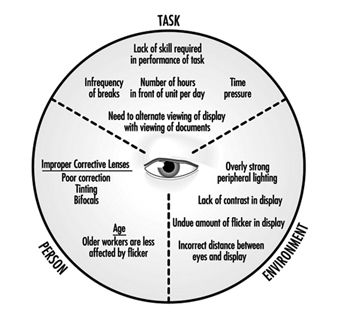
Many of the appropriate characteristics of workstation layout are described more fully earlier in the chapter.
The best viewing distance for visual comfort which still leaves enough space for the keyboard appears to be about 65 cm. However, according to many experts, such as Akabri and Konz (1991), ideally, “it would be best to determine an individual’s dark focus so workstations could be adjusted to specific individuals rather than population means”. As far as the characters themselves go, in general, a good rule of thumb is “bigger is better”. Usually, letter size increases with the size of the screen, and a compromise is always struck between the readability of letters and the number of words and sentences that can be displayed on the screen at one time. The VDU itself should be selected according to the task requirements and should try to maximize user comfort.
In addition to the design of the workstation and the VDU itself is the need to allow the eyes to rest. This is particularly important in unskilled jobs, in which the freedom of “moving around” is generally much lower than in skilled jobs. Data entry work or other activities of the same type are usually performed under time pressure, sometimes even accompanied by electronic supervision, which times operator output very precisely. In other interactive VDU jobs which involve using databases, operators are obliged to wait for a response from the computer and thus must remain at their posts.
Flicker and eye discomfort
Flicker is the change in brightness of the characters on the screen over time and is more fully described above. When characters do not refresh themselves frequently enough, some operators are able to perceive flicker. Younger workers may be more affected since their flicker fusion frequency is higher than that of older people (Grandjean 1987). The rate of flicker increases with increase in brightness, which is one reason why many VDU operators do not commonly make use of the whole range of brightness of the screen that are available. In general a VDU with a refresh rate of at least 70 Hz should “fit” the visual needs of a large proportion of VDU operators.
The sensitivity of the eyes to flicker is enhanced by increased brightness and contrast between the fluctuating area and the surrounding area. The size of the fluctuating area also affects sensitivity because the larger the area to be viewed, the larger the area of the retina that is stimulated. The angle at which the light from the fluctuating area strikes the eye and the amplitude of modulation of the fluctuating area are other important variables.
The older the VDU user, the less sensitive the eye because older eyes are less transparent and the retina is less excitable. This is also true in sick people. Laboratory findings such as these help to explain the observations made in the field. For example, it has been found that operators are disturbed by flicker from the screen when reading paper documents (Isensee and Bennett as quoted in Grandjean 1987), and the combination of fluctuation from the screen and fluctuation of fluorescent light has been found to be particularly disturbing.
Lighting
The eye functions best when the contrast between the visual target and its background is maximum, as for example, with a black letter on white paper. Efficiency is further enhanced when the outer edge of the visual field is exposed to slightly lower levels of brightness. Unfortunately, with a VDU the situation is just the reverse of this, which is one reason that so many VDU operators try to protect their eyes against excess light.
Inappropriate contrasts in brightness and unpleasant reflections produced by fluorescent light, for example, can lead to visual complaints among VDU operators. In one study, 40% of 409 VDU workers made such complaints (Läubli et al., 1989).
In order to minimize problems with lighting, just as with viewing distances, flexibility is important. One should be able to adapt light sources to the visual sensitivity of individuals. Workplaces should be provided to offer individuals the opportunity to adjust their lighting.
Job characteristics
Jobs which are carried out under time pressure, especially if they are unskilled and monotonous, are often accompanied by sensations of general fatigue, which, in turn, can give rise to complaints of visual discomfort. In the authors’ laboratory, it was found that visual discomfort increased with the number of accommodative changes the eyes needed to make to carry out the task. This occurred more often in data entry or word processing than in tasks which involved dialogues with the computer. Jobs which are sedentary and provide little opportunity for moving around also provide less opportunity for muscular recovery and hence enhance the likelihood of visual discomfort.
Job organization
Eye discomfort is just one aspect of the physical and mental problems that can be associated with many jobs, as described more fully elsewhere in this chapter. It is not surprising, therefore, to find a high correlation between the level of eye discomfort and job satisfaction. Although night work is still not widely practised in office work, its effects on eye discomfort in VDU work may well be unexpected. This is because, although there are few data as yet available to confirm this, on the one hand, eye capacity during the night shift may be somehow depressed and thus more vulnerable to VDU effects, while on the other hand, the lighting environment is easier to adjust without disturbance from natural lighting, provided that the reflections from fluorescent lamps on dark windows are eliminated.
Individuals who use VDUs to work at home should ensure that they provide themselves with the appropriate equipment and lighting conditions to avoid the adverse environmental factors found in many formal workplaces.
Medical Surveillance
No single, particular hazardous agent has been identified as a visual risk. Asthenopia among VDU operators appears rather to be an acute phenomenon, although there is some belief that sustained strain of accommodation may occur. Unlike many other chronic diseases, misadjustment to VDU work is usually noticed very soon by the “patient”, who may be more likely to seek medical care than will workers in other workplace situations. After such visits, spectacles are often prescribed, but unfortunately they are sometimes ill adapted to needs of the workplace which have been described here. It is essential that practitioners be specially trained to care for patients who work with VDUs. A special course, for example, has been created at the Swiss Federal Institute of Technology in Zurich just for this purpose.
The following factors must be taken into consideration in caring for VDU workers. In comparison to traditional office work, the distance between the eye and the visual target, the screen, is usually of 50 to 70 cm and cannot be changed. Therefore, lenses should be prescribed which take this steady viewing distance into account. Bifocal lenses are inappropriate because they will require a painful extension of the neck in order for the user to read the screen. Multifocal lenses are better, but as they limit rapid eye movements, their use can lead to more head movements, producing additional strain.
Eye correction should be as precise as possible, taking into account the slightest visual defects (e.g., astigmatism) and also the viewing distance of the VDU. Tinted glasses which reduce the illumination level in the centre of the visual field should not be prescribed. Partially tinted spectacles are not useful, since eyes at the workplace are always moving in all directions. Offering special spectacles to employees, however, should not mean that further complaints of visual discomfort from workers may be ignored since the complaints could be justified by poor ergonomic design of the workstation and equipment.
It should be said, finally, that the operators who suffer the most discomfort are those who need raised illumination levels for detail work and who, at the same time, have a higher glare sensitivity. Operators with undercorrected eyes will thus display a tendency to get closer to the screen for more light and will be in this way more exposed to flicker.
Screening and secondary prevention
The usual principles of secondary prevention in public health are applicable to the working environment. Screening therefore should be targeted towards known hazards and is most useful for diseases with long latency periods. Screening should take place prior to any evidence of preventable disease and only tests with high sensitivity, high specificity and high predictive power are useful. The results of screening examinations can be used to assess the extent of exposure both of individuals and of groups.
Since no severe adverse effects on the eye have ever been identified in VDU work, and since no hazardous level of radiations associated with visual problems have been detected, it has been agreed that there is no indication that work with VDUs “will cause disease or damage to the eye” (WHO 1987). The ocular fatigue and eye discomfort that have been reported to occur in VDU operators are not the kinds of health effect which generally form the basis for medical surveillance in a secondary prevention programme.
However, pre-employment visual medical examinations of VDU operators are widespread in most member countries of the International Labour Organization, a requirement supported by trade unions and employers (ILO 1986). In many European countries (including France, the Netherlands and the United Kingdom), medical surveillance for VDU operators, including ocular tests, has also been instituted subsequent to the issuing of Directive 90/270/EEC on work with display screen equipment.
If a programme for the medical surveillance of VDU operators is to be set up, the following issues must be addressed in addition to deciding on the contents of the screening programme and the appropriate testing procedures:
- What is the meaning of the surveillance and how should its results be interpreted?
- Are all VDU operators in need of the surveillance?
- Are any ocular effects which are observed appropriate for a secondary prevention programme?
Most routine visual screening tests available to the occupational physician have poor sensitivity and predictive power for eye discomfort associated with VDU work (Rey and Bousquet 1990). Snellen visual testing charts are particularly inappropriate for the measurement of visual acuity of VDU operators and for predicting their eye discomfort. In Snellen charts the visual targets are dark, precise letters on a clear, well illuminated background, not at all like typical VDU viewing conditions. Indeed, because of the inapplicability of other methods, a testing procedure has been developed by the authors (the C45 device) which simulates the reading and lighting conditions of a VDU workplace. Unfortunately, this remains for the time being a laboratory set-up. It is important to realise, however, that screening examinations are not a substitute for a well-designed workplace and good work organization.
Ergonomic Strategies to Reduce Visual Discomfort
Although systematic ocular screening and systematic visits to the eye specialist have not been shown to be effective in reducing visual symptomatology, they have been widely incorporated into occupational health programmes for VDU workers. A more cost-effective strategy could include an intensive ergonomic analysis of both the job and the workplace. Workers with known ocular diseases should try to avoid intensive VDU work as much as possible. Poorly corrected vision is another potential cause of operator complaints and should be investigated if such complaints occur. The improvement of the ergonomics of the workplace, which could include providing for a low reading angle to avoid a decreased blinking rate and neck extension, and providing the opportunity to rest and to move about on the job, are other effective strategies. New devices, with separate keyboards, allow distances to be adjusted. The VDU may also be made to be moveable, such as by placing it on a mobile arm. Eye strain will thus be reduced by permitting changes in viewing distance which match the corrections to the eye. Often the steps taken to reduce muscular pain in the arms, shoulders and back will at the same time also allow the ergonomist to reduce visual strain. In addition to the design of equipment, the quality of the air can affect the eye. Dry air leads to dry eyes, so that appropriate humidification is needed.
In general the following physical variables should be addressed:
- the distance between the screen and the eye
- the reading angle, which determines the position of the head and the neck
- the distance to walls and windows
- the quality of paper documents (often very poor)
- luminances of screen and surroundings (for artificial and natural lighting)
- flicker effects
- glare sources and reflections
- the humidity level.
Among the organizational variables that should be addressed in improving visual working conditions are:
- content of the task, responsibility level
- time schedules, night work, duration of work
- freedom to “move around”
- full time or part time jobs, etc.
Reproductive Hazards - Experimental Data
The purpose of the experimental studies described here, using animal models is, in part, to answer the question as to whether extremely low frequency (ELF) magnetic field exposures at levels similar to those around VDU workstations can be shown to affect reproductive functions in animals in a manner that can be equated to a human health risk.
The studies considered here are limited to in vivo studies (those performed on live animals) of reproduction in mammals exposed to very low frequency (VLF) magnetic fields with appropriate frequencies, excluding, therefore, studies on the biological effects in general of VLF or ELF magnetic fields. These studies on experimental animals fail to demonstrate unequivocally that magnetic fields, such as are found around VDUs, affect reproduction. Moreover, as can be seen from considering the experimental studies described in some detail below, the animal data do not shed a clear light on possible mechanisms for human reproductive effects of VDU use. These data complement the relative absence of indications of a measurable effect of VDU use on reproductive outcomes from human population studies.
Studies of Reproductive Effects of VLF Magnetic Fields in Rodents
VLF magnetic fields similar to those around VDUs have been used in five teratological studies, three with mice and two with rats. The results of these studies are summarized in table 1. Only one study (Tribukait and Cekan 1987), found an increased number of foetuses with external malformations. Stuchly et al. (1988) and Huuskonen, Juutilainen and Komulainen (1993) both reported a significant increase in the number of foetuses with skeletal abnormalities, but only when the analysis was based on the foetus as a unit. The study by Wiley and Corey (1992) did not demonstrate any effect of magnetic field exposures on placental resorption, or other pregnancy outcomes. Placental resorptions roughly correspond to spontaneous abortions in humans. Finally, Frölén and Svedenstål (1993) performed a series of five experiments. In each experiment, the exposure occurred on a different day. Among the first four experimental subgroups (start day 1–start day 5), there were significant increases in the number of placental resorptions among exposed females. No such effects were seen in the experiment where exposure started on day 7 and which is illustrated in figure 1.
Table 1. Teratological studies with rats or mice exposed to 18-20 kHz saw-tooth formed magnetic fields
|
Magnetic field exposure |
|||||
|
Study |
Subject1 |
Frequency |
Amplitude2 |
Duration3 |
Results4 |
|
Tribukait and Cekan (1987) |
76 litters of mice |
20 kHz |
1 μT, 15 μT |
Exposed to day 14 of pregnancy |
Significant increase in external malformation; only if foetus is used as the unit of observation; and only in the first half of the experiment; no difference as to resorption or foetal death. |
|
Stuchly et al. |
20 litters of rats |
18 kHz |
5.7μT, 23μT, |
Exposed throughout |
Significant increase in minor skeletal malformations; only if foetus is used as the unit of observation; some decrease in blood cell concentrations no difference as to resorption, nor as to other types of malformations |
|
Wiley and Corey |
144 litters of |
20 kHz |
3.6 μT, 17μT, |
Exposed throughout |
No difference as to any observed outcome (malformation, |
|
Frölén and |
In total 707 |
20 kHz |
15 μT |
Beginning on various days of pregnancy in |
Significant increase in resorption; only if exposure starts on day 1 to day 5; no difference as to malformations |
|
Huuskonen, |
72 litters of rats |
20 kHz |
15 μT |
Exposed to day 12 of pregnancy |
Significant increase in minor skeletal malformations; only if foetus is used as the unit of observation; no difference as to |
1 Total number of litters in the maximum exposure category.
2 Peak-to-peak amplitude.
3 Exposure varied from 7 to 24 hours/day in different experiments.
4 “Difference” refers to statistical comparisons between exposed and unexposed animals, “increase” refers to a comparison of the highest exposed group vs. the unexposed group.
Figure 1. The percentage of female mice with placental resorptions in relation to exposure
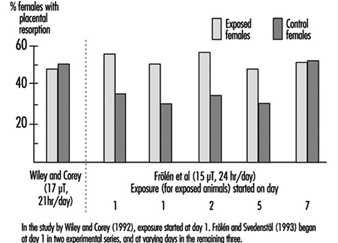
The interpretations given by the researchers to their findings include the following. Stuchly and co-workers reported that the abnormalities they observed were not unusual and ascribed the result to “common noise that appears in every teratological evaluation”. Huuskonen et al., whose findings were similar to Stuchly et al., were less negative in their appraisal and considered their result to be more indicative of a real effect, but they too remarked in their report that the abnormalities were “subtle and would probably not impair the later development of the foetuses”. In discussing their findings in which effects were observed in the early onset exposures but not the later ones, Frölén and Svedenstål suggest that the effects observed could be related to early effects on reproduction, before the fertilized egg is implanted in the uterus.
In addition to the reproductive outcomes, a decrease in white and red blood cells were noted in the highest exposure group in the study by Stuchly and co-workers. (Blood cell counts were not analysed in the other studies.) The authors, while suggesting that this could indicate a mild effect of the fields, also noted that the variations in blood cell counts were “within the normal range”. The absence of histological data and the absence of any effects on bone marrow cells made it difficult to evaluate these latter findings.
Interpretation and comparison of studies
Few of the results described here are consistent with one another. As stated by Frölén and Svedenstål, “qualitative conclusions with regard to corresponding effects in human beings and test animals may not be drawn”. Let us examine some of the reasoning that could lead to such a conclusion.
The Tribukait findings are generally not considered to be conclusive for two reasons. First, the experiment only yielded positive effects when the foetus was used as the unit of observation for statistical analysis, whereas the data themselves actually indicated a litter-specific effect. Second, there is a discrepancy in the study between the findings in the first and the second part, which implies that the positive findings may be the result of random variations and/or uncontrolled factors in the experiment.
Epidemiological studies investigating specific malformations have not observed an increase in skeletal malformations among children born of mothers working with VDUs—and thus exposed to VLF magnetic fields. For these reasons (foetus-based statistical analysis, abnormalities probably not health-related, and lack of concordance with epidemiological findings), the results—on minor skeletal malformations—are not such as to provide a firm indication of a health risk for humans.
Technical Background
Units of observation
When statistically evaluating studies on mammals, consideration must be given to at least one aspect of the (often unknown) mechanism. If the exposure affects the mother—which in turn affects the foetuses in the litter, it is the status of the litter as a whole which should be used as the unit of observation (the effect which is being observed and measured), since the individual outcomes among litter-mates are not independent. If, on the other hand, it is hypothesized that the exposure acts directly and independently on the individual foetuses within the litter, then one can appropriately use the foetus as a unit for statistical evaluation. The usual practice is to count the litter as the unit of observation, unless evidence is available that the effect of the exposure on one foetus is independent of the effect on the other foetuses in the litter.
Wiley and Corey (1992) did not observe a placental resorption effect similar to that seen by Frölén and Svedenstål. One reason put forward for this discrepancy is that different strains of mice were used, and the effect could be specific for the strain used by Frölén and Svedenstål. Apart from such a speculated species effect, it is also noteworthy that both females exposed to 17 μT fields and controls in the Wiley study had resorption frequencies similar to those in exposed females in the corresponding Frölén series, whereas most non-exposed groups in the Frölén study had much lower frequencies (see figure 1). One hypothetical explanation could be that a higher stress level among the mice in the Wiley study resulted from the handling of animals during the three hour period without exposure. If this is the case, an effect of the magnetic field could perhaps have been “drowned” by a stress effect. While it is difficult to definitely dismiss such a theory from the data provided, it does appear somewhat far-fetched. Furthermore, a “real” effect attributable to the magnetic field would be expected to be observable above such a constant stress effect as the magnetic field exposure increased. No such trend was observed in the Wiley study data.
The Wiley study reports on environmental monitoring and on rotation of cages to eliminate the effects of uncontrolled factors which might vary within the room environment itself, as magnetic fields can, while the Frölén study does not. Thus, control of “other factors” is at least better documented in the Wiley study. Hypothetically, uncontrolled factors that were not randomized could conceivably offer some explanations. It is also interesting to note that the lack of effect observed in the day 7 series of the Frölén study appears to be due not to a decrease in the exposed groups, but to an increase in the control group. Thus variations in the control group are probably important to consider while comparing the disparate results of the two studies.
Studies of Reproductive Effects of ELF Magnetic Fields in Rodents
Several studies have been performed, mostly on rodents, with 50–80 Hz fields. Details on six of these studies are shown in table 2. While other studies of ELF have been carried out, their results have not appeared in the published scientific literature and are generally available only as abstracts from conferences. In general the findings are of “random effects”, “no differences observed” and so on. One study, however, found a reduced number of external abnormalities in CD–1 mice exposed to a 20 mT, 50 Hz field but the authors suggested that this might reflect a selection problem. A few studies have been reported on species other than rodents (rhesus monkeys and cows), again apparently without observations of adverse exposure effects.
Table 2. Teratological studies with rats or mice exposed to 15-60 Hz sinusoidal or square pulsed magnetic fields
|
Magnetic field exposure |
||||||
|
Study |
Subject1 |
Frequency |
Amplitude |
Description |
Exposure duration |
Results |
|
Rivas and Rius |
25 Swiss mice |
50 Hz |
83 μT, 2.3 mT |
Pulsed, 5 ms pulse duration |
Before and during pregnancy and offspring growth; total 120 days |
No significant differences at birth in any measured parameter; decreased male body weight when adult |
|
Zecca et al. (1985) |
10 SD rats |
50 Hz |
5.8 mT |
Day 6-15 of pregnancy, |
No significant differences |
|
|
Tribukait and Cekan (1987) |
35 C3H mice |
50 Hz |
1 μT, 15 μT |
Square wave-forms, 0.5 ms duration |
Day 0-14 of pregnancy, |
No significant differences |
|
Salzinger and |
41 off-springs of SD rats. Only male pups used |
60 Hz |
100 μT (rms). Also electric |
Uniform circular polarized |
Day 0-22 of pregnancy and |
Lower increase in operand response during training commencing at 90 days of age |
|
McGivern and |
11 offsprings of SD rats. Only male pups used. |
15 Hz |
800 μT (peak) |
Square wave-forms, 0.3 ms duration |
Day 15-20 of pregnancy, |
Territorial scent marking behaviour reduced at 120 days of age. |
|
Huuskonen et al. |
72 Wistar rats |
50 Hz |
12.6μT (rms) |
Sinusoidal |
Day 0-12 of pregnancy, |
More foetuses/litter. Minor skeletal malformations |
1 Number of animals (mothers) in the highest exposure category given unless otherwise noted.
As can be seen from table 2, a wide range of results were obtained. These studies are more difficult to summarize because there are so many variations in exposure regimens, the endpoints under study as well as other factors. The foetus (or the surviving, “culled” pup) was the unit used in most studies. Overall, it is clear that these studies do not show any gross teratogenic effect of magnetic field exposure during pregnancy. As remarked above, “minor skeletal anomalies” do not appear to be of importance when evaluating human risks. The behavioural study results of Salzinger and Freimark (1990) and McGivern and Sokol (1990) are intriguing, but they do not form a basis for indications of human health risks at a VDU workstation, either from the standpoint of procedures (use of the foetus, and, for McGivern, a different frequency) or of effects.
Summary of specific studies
Behavioural retardation 3–4 months after birth was observed in the offspring of exposed females by Salzinger and McGivern. These studies appear to have used individual offspring as the statistical unit, which may be questionable if the stipulated effect is due to an effect on the mother. The Salzinger study also exposed the pups during the first 8 days after birth, so that this study involved more than reproductive hazards. A limited number of litters was used in both studies. Furthermore, these studies cannot be considered to confirm each other’s findings since the exposures varied greatly between them, as can be seen in table 2.
Apart from a behavioural change in the exposed animals, the McGivern study noted an increased weight of some male sex organs: the prostate, the seminal vesicles and the epididymis (all parts of the male reproductive system). The authors speculate as to whether this could be linked to stimulation of some enzyme levels in the prostate since magnetic field effects on some enzymes present in the prostate have been observed for 60 Hz.
Huuskonen and co-workers (1993) noted an increase in the number of foetuses per litter (10.4 foetuses/litter in the 50 Hz exposed group vs. 9 foetuses/litter in the control group). The authors, who had not observed similar trends in other studies, downplayed the importance of this finding by noting that it “may be incidental rather than an actual effect of the magnetic field”. In 1985 Rivas and Rius reported a different finding with a slightly lower number of live births per litter among exposed versus nonexposed groups. The difference was not statistically significant. They carried out the other aspects of their analyses on both a “per foetus” and “per litter” basis. The noted increase in minor skeletal malformations was only seen with the analysis using the foetus as the unit of observation.
Recommendations and Summary
Despite the relative lack of positive, consistent data demonstrating either human or animal reproductive effects, attempts at replications of the results of some studies are still warranted. These studies should attempt to reduce the variations in exposures, methods of analysis and strains of animals used.
In general, the experimental studies performed with 20 kHz magnetic fields have provided somewhat varied results. If adhering strictly to the litter analysis procedure and statistical hypothesis testing, no effects have been shown in rats (although similar nonsignificant findings were made in both studies). In mice, the results have been varied, and no single coherent interpretation of them appears possible at present. For 50 Hz magnetic fields, the situation is somewhat different. Epidemiological studies which are relevant to this frequency are scarce, and one study did indicate a possible risk of miscarriage. By contrast, the experimental animal studies have not produced results with similar outcomes. Overall, the results do not establish an effect of extremely low frequency magnetic fields from VDUs on the outcome of pregnancies. The totality of results fails thus to suggest an effect of VLF or ELF magnetic fields from VDUs on reproduction.
Reproductive Effects - Human Evidence
The safety of visual display units (VDUs) in terms of reproductive outcomes has been questioned since the widespread introduction of VDUs in the work environment during the 1970s. Concern for adverse pregnancy outcomes was first raised as a result of numerous reports of apparent clusters of spontaneous abortion or congenital malformations among pregnant VDU operators (Blackwell and Chang 1988). While these reported clusters were determined to be no more than what could be expected by chance, given the widespread use of VDUs in the modern workplace (Bergqvist 1986), epidemiologic studies were undertaken to explore this question further.
From the published studies reviewed here, a safe conclusion would be that, in general, working with VDUs does not appear to be associated with an excess risk of adverse pregnancy outcomes. However, this generalized conclusion applies to VDUs as they are typically found and used in offices by female workers. If, however, for some technical reason, there existed a small proportion of VDUs which did induce a strong magnetic field, then this general conclusion of safety could not be applied to that special situation since it is unlikely that the published studies would have had the statistical ability to detect such an effect. In order to be able to have generalizable statements of safety, it is essential that future studies be carried out on the risk of adverse pregnancy outcomes associated with VDUs using more refined exposure measures.
The most frequently studied reproductive outcomes have been:
- Spontaneous abortion (10 studies): usually defined as a hospitalized unintentional cessation of pregnancy occurring before 20 weeks of gestation.
- Congenital malformation (8 studies): many different types were assessed, but in general, they were diagnosed at birth.
- Other outcomes (8 studies) such as low birthweight (under 2,500 g), very low birthweight (under 1,500 g), and fecundability (time to pregnancy from cessation of birth control use) have also been assessed. See table 1.
Table 1. VDU use as a factor in adverse pregnancy outcomes
|
Objectives |
Methods |
Results |
|||||
|
Study |
Outcome |
Design |
Cases |
Controls |
Exposure |
OR/RR (95% CI) |
Conclusion |
|
Kurppa et al. |
Congenital malformation |
Case-control |
1, 475 |
1, 475 same age, same delivery date |
Job titles, |
235 cases, |
No evidence of increased risk among women who reported exposure to VDU or among women whose job titles indicated possible exposure |
|
Ericson and Källén (1986) |
Spontaneous abortion, |
Case-case |
412 |
1, 032 similar age and from same registry |
Job titles |
1.2 (0.6-2.3) |
The effect of VDU use was not statistically significant |
|
Westerholm and Ericson |
Stillbirth, |
Cohort |
7 |
4, 117 |
Job titles |
1.1 (0.8-1.4) |
No excesses were found for any of the studied outcomes. |
|
Bjerkedal and Egenaes (1986) |
Stillbirth, |
Cohort |
17 |
1, 820 |
Employment records |
NR(NS) |
The study concluded that there was no indication that introduction of VDUs in the centre has led to any increase in the rate of adverse pregnancy outcomes. |
|
Goldhaber, Polen and Hiatt |
Spontaneous abortion, |
Case-control |
460 |
1, 123 20% of all normal births, same region, same time |
Postal questionnaire |
1.8 (1.2-2.8) |
Statistically increased risk for spontaneous abortions for VDU exposure. No excess risk for congenital malformations associates with VDU exposure. |
|
McDonald et al. (1988) |
Spontaneous abortion, |
Cohort |
776 |
Face-to-face interviews |
1.19 (1.09-1.38) |
No increase in risk was found among women exposed to VDUs. |
|
|
Nurminen and Kurppa (1988) |
Threatened abortion, |
Cohort |
239 |
Face-to-face interviews |
0.9 |
The crude and adjusted rate ratios did not show statistically significant effects for working with VDUs. |
|
|
Bryant and Love (1989) |
Spontaneous abortion |
Case-control |
344 |
647 |
Face-to-face interviews |
1.14 (p = 0.47) prenatal |
VDU use was similar between the cases and both the prenatal controls and postnatal controls. |
|
Windham et al. (1990) |
Spontaneous abortion, |
Case-control |
626 |
1,308 same age, same last menstrual period |
Telephone interviews |
1.2 (0.88-1.6) |
Crude odds ratios for spontaneous abortion and VDU use less than 20 hours per week were 1.2; 95% CI 0.88-1.6, minimum of 20 hours per week were 1.3; 95% CI 0.87-1.5. Risks for low birthweight and intra-uterine growth retardation were not significantly elevated. |
|
Brandt and |
Congenital malformation |
Case-control |
421 |
1,365; 9.2% of all pregnancies, same registry |
Postal questionnaire |
0.96 (0.76-1.20) |
Use of VDUs during pregnancy was not associated with a risk of congenital malformations. |
|
Nielsen and |
Spontaneous abortion |
Case-control |
1,371 |
1,699 9.2% |
Postal questionnaire |
0.94 (0.77-1.14) |
No statistically significant risk for spontaneous abortion with VDU exposure. |
|
Tikkanen and Heinonen |
Cardiovascular malformations |
Case-control |
573 |
1,055 same time, hospital delivery |
Face-to-face interviews |
Cases 6.0%, controls 5.0% |
No statistically significant association between VDU use and cardiovascular malformation |
|
Schnorr et al. |
Spontaneous abortion |
Cohort |
136 |
746 |
Company records measurement of magnetic field |
0.93 (0.63-1.38) |
No excess risk for women who used VDUs during first trimester and no apparent |
|
Brandt and |
Time to pregnancy |
Cohort |
188 |
Postal questionnaire |
1.61 (1.09-2.38) |
For a time to pregnancy of greater than 13 months, there was an increased relative risk for the group with at least 21 hours of weekly VDU use. |
|
|
Nielsen and |
Low birthweight, |
Cohort |
434 |
Postal questionnaire |
0.88 (0.67-1.66) |
No increase in risk was found among women exposed to VDUs. |
|
|
Roman et al. |
Spontaneous abortion |
Case-control |
150 |
297 nulliparous hospital |
Face-to-face interviews |
0.9 (0.6-1.4) |
No relation to time spent using VDUs. |
|
Lindbohm |
Spontaneous abortion |
Case-control |
191 |
394 medical registers |
Employment records field measurement |
1.1 (0.7-1.6), |
Comparing workers with exposure to high magnetic field strengths to those with undetectable levels the ratio was 3.4 (95% CI 1.4-8.6) |
OR = Odds ratio. CI = Confidence Interval. RR = Relative risk. NR = Value not reported. NS = Not statistically significant.
Discussion
Evaluations of reported clusters of adverse pregnancy outcomes and VDU use have concluded that there was a high probability that these clusters occurred by chance (Bergqvist 1986). In addition, the results of the few epidemiologic studies which have assessed the relation between VDU use and adverse pregnancy outcomes have, on the whole, not shown a statistically significant increased risk.
In this review, out of ten studies of spontaneous abortion, only two found a statistically significant increased risk for VDU exposure (Goldhaber, Polen and Hiatt 1988; Lindbohm et al. 1992). None of the eight studies on congenital malformations showed an excess risk associated with VDU exposure. Of the eight studies which looked at other adverse pregnancy outcomes, one has found a statistically significant association between waiting time to pregnancy and VDU use (Brandt and Nielsen 1992).
Although there are no major differences between the three studies with positive findings and those with negative ones, improvements in exposure assessment may have increased the chances of finding a significant risk. Though not exclusive to the positive studies, these three studies attempted to divide the workers into different levels of exposure. If there is a factor inherent in VDU use which predisposes a woman to adverse pregnancy outcomes, the dose received by the worker may influence the outcome. In addition, the results of the studies by Lindbohm et al. (1992) and Schnorr et al. (1991) suggest that only a small proportion of the VDUs may be responsible for increasing the risk of spontaneous abortion among users. If this is the case, failure to identify these VDUs will introduce a bias that could lead to underestimating the risk of spontaneous abortion among VDU users.
Other factors associated with work on VDUs, such as stress and ergonomic constraints, have been suggested as possible risk factors for adverse pregnancy outcomes (McDonald et al. 1988; Brandt and Nielsen 1992). Failure of many studies to control for these possible confounders may have lead to unreliable results.
While it may be biologically plausible that exposure to high levels of extremely low frequency magnetic fields through some VDUs carries an increased risk for adverse pregnancy outcomes (Bergqvist 1986), only two studies have attempted to measure these (Schnorr et al. 1991; Lindbohm et al. 1992). Extremely low frequency magnetic fields are present in any environment where electricity is used. A contribution of these fields to adverse pregnancy outcomes could only be detected if there was a variation, in time or in space, of these fields. While VDUs contribute to the overall levels of magnetic fields in the workplace, only a small percentage of the VDUs are thought to have a strong influence on the magnetic fields measured in the working environment (Lindbohm et al. 1992). Only a fraction of the women working with VDUs are thought to be exposed to levels of magnetic radiation above that which is normally encountered in the working environment (Lindbohm et al. 1992). The lack of precision in exposure assessment encountered in counting all VDU users as “exposed” weakens the ability of a study to detect the influence of magnetic fields from VDUs on adverse pregnancy outcomes.
In some studies, women who are not gainfully employed represented a large proportion of the comparison groups for women exposed to VDUs. In this comparison, certain selective processes may have affected the results (Infante-Rivard et al. 1993); for instance, women with severe diseases are selected out of the workforce, leaving healthier women more likely to have favourable reproductive outcomes in the workforce. On the other hand, an “unhealthy pregnant worker effect” is also possible, since women who have children may stop work, whereas those without children and who experience pregnancy loss may continue working. A suggested strategy to estimate the magnitude of this bias is to do separate analyses with and without women not gainfully employed.
Musculoskeletal Disorders
Introduction
VDU operators commonly report musculoskeletal problems in the neck, shoulders and upper limbs. These problems are not unique to VDU operators and are also reported by other workers performing tasks which are repetitive or which involve holding the body in a fixed posture (static load). Tasks which involve force are also commonly associated with musculoskeletal problems, but such tasks are not generally an important health and safety consideration for VDU operators.
Among clerical workers, whose jobs are generally sedentary and not commonly associated with physical stress, the introduction into workplaces of VDUs caused work-related musculoskeletal problems to gain in recognition and prominence. Indeed, an epidemic-like increase in reporting of problems in Australia in the mid 1980s and, to a lesser extent, in the United States and the United Kingdom in the early 1990s, has led to a debate about whether or not the symptoms have a physiological basis and whether or not they are work-related.
Those who dispute that musculoskeletal problems associated with VDU (and other) work have a physiological basis generally put forward one of four alternative views: workers are malingering; workers are unconsciously motivated by various possible secondary gains, such as workers’ compensation payments or the psychological benefits of being sick, known as compensation neurosis; workers are converting unresolved psychological conflict or emotional disturbance into physical symptoms, that is, conversion disorders; and finally, that normal fatigue is being blown out of proportion by a social process which labels such fatigue as a problem, termed social iatrogenesis. Rigorous examination of the evidence for these alternative explanations shows that they are not as well supported as explanations which posit a physiological basis for these disorders (Bammer and Martin 1988). Despite the growing evidence that there is a physiological basis for musculoskeletal complaints, the exact nature of the complaints is not well understood (Quintner and Elvey 1990; Cohen et al. 1992; Fry 1992; Helme, LeVasseur and Gibson 1992).
Symptom Prevalence
A large number of studies have documented the prevalence of musculoskeletal problems among VDU operators and these have been predominantly conducted in western industrialized countries. There is also growing interest in these problems in the rapidly industrializing nations of Asia and Latin America. There is considerable inter-country variation in how musculoskeletal disorders are described and in the types of studies carried out. Most studies have relied on symptoms reported by workers, rather than on the results of medical examinations. The studies can be usefully divided into three groups: those which have examined what can be called composite problems, those which have looked at specific disorders and those which have concentrated on problems in a single area or small group of areas.
Composite problems
Composite problems are a mixture of problems, which can include pain, loss of strength and sensory disturbance, in various parts of the upper body. They are treated as a single entity, which in Australia and the United Kingdom is referred to as repetitive strain injuries (RSI), in the United States as cumulative trauma disorders (CTD) and in Japan as occupational cervicobrachial disorders (OCD). A 1990 review (Bammer 1990) of problems among office workers (75% of the studies were of office workers who used VDUs) found that 70 studies had examined composite problems and 25 had found them to occur in a frequency range of between 10 and 29% of the workers studied. At the extremes, three studies had found no problems, while three found that 80% of workers suffer from musculoskeletal complaints. Half of the studies also reported on severe or frequent problems, with 19 finding a prevalence between 10 and 19%. One study found no problems and one found problems in 59%. The highest prevalences were found in Australia and Japan.
Specific disorders
Specific disorders cover relatively well-defined problems such as epicondylitis and carpal tunnel syndrome. Specific disorders have been less frequently studied and found to occur less frequently. Of 43 studies, 20 found them to occur in between 0.2 and 4% of workers. Five studies found no evidence of specific disorders and one found them in between 40–49% of workers.
Particular body parts
Other studies focus on particular areas of the body, such as the neck or the wrists. Neck problems are the most common and have been examined in 72 studies, with 15 finding them to occur in between 40 and 49% of workers. Three studies found them to occur in between 5 and 9% of workers and one found them in more than 80% of workers. Just under half the studies examined severe problems and they were commonly found in frequencies that ranged between 5% and 39%. Such high levels of neck problems have been found internationally, including Australia, Finland, France, Germany, Japan, Norway, Singapore, Sweden, Switzerland, the United Kingdom and the United States. In contrast, only 18 studies examined wrist problems, and seven found them to occur in between 10% and 19% of workers. One found them to occur in between 0.5 and 4% of workers and one in between 40% and 49%.
Causes
It is generally agreed that the introduction of VDUs is often associated with increased repetitive movements and increased static load through increased keystroke rates and (compared with typewriting) reduction in non-keying tasks such as changing paper, waiting for the carriage return and use of correction tape or fluid. The need to watch a screen can also lead to increased static load, and poor placement of the screen, keyboard or function keys can lead to postures which may contribute to problems. There is also evidence that the introduction of VDUs can be associated with reductions in staff numbers and increased workloads. It can also lead to changes in the psychosocial aspects of work, including social and power relationships, workers’ responsibilities, career prospects and mental workload. In some workplaces such changes have been in directions which are beneficial to workers.
In other workplaces they have led to reduced worker control over the job, lack of social support on the job, “de-skilling”, lack of career opportunities, role ambiguity, mental stress and electronic monitoring (see review by Bammer 1987b and also WHO 1989 for a report on a World Health Organization meeting). The association between some of these psychosocial changes and musculoskeletal problems is outlined below. It also seems that the introduction of VDUs helped stimulate a social movement in Australia which led to the recognition and prominence of these problems (Bammer and Martin 1992).
Causes can therefore be examined at individual, workplace and social levels. At the individual level, the possible causes of these disorders can be divided into three categories: factors not related to work, biomechanical factors and work organization factors (see table 1). Various approaches have been used to study causes but the overall results are similar to those obtained in empirical field studies which have used multivariate analyses (Bammer 1990). The results of these studies are summarized in table 1 and table 2. More recent studies also support these general findings.
Table 1. Summary of empirical fieldwork studies which have used multivariate analyses to study the causes of musculoskeletal problems among office workers
|
Factors |
||||
|
|
|
|
|
Work organisation |
|
Blignault (1985) |
146/90% |
ο |
ο |
● |
|
South Australian Health Commission Epidemiology Branch (1984) |
456/81% |
●
|
●
|
●
|
|
Ryan, Mullerworth and Pimble (1984) |
52/100% |
● |
●
|
●
|
|
Ryan and |
143 |
|||
|
Ellinger et al. (1982) |
280 |
● |
●
|
● |
|
Pot, Padmos and |
222/100% |
not studied |
● |
● |
|
Sauter et al. (1983b) |
251/74% |
ο |
●
|
● |
|
Stellman et al. (1987a) |
1, 032/42% |
not studied |
●
|
● |
ο = non-factor ●= factor.
Source: Adapted from Bammer 1990.
Table 2. Summary of studies showing involvement of factors thought to cause musculoskeletal problems among office workers
|
Non-work |
Biomechanical |
Work organization |
|||||||||||||
|
Country |
No./% VDU |
Age |
Biol. |
Neuro ticism |
Joint |
Furn. |
Furn. |
Visual |
Visual |
Years |
Pressure |
Autonomy |
Peer |
Variety |
Key- |
|
Australia |
146/ |
Ø |
Ø |
Ø |
Ø |
Ο |
● |
● |
● |
Ø |
|||||
|
Australia |
456/ |
● |
Ο |
❚ |
Ø |
Ο |
● |
Ο |
|||||||
|
Australia |
52/143/ |
▲ |
❚ |
❚ |
Ο |
Ο |
● |
Ο |
|||||||
|
Germany |
280 |
Ο |
Ο |
❚ |
Ø |
❚ |
Ο |
Ο |
● |
● |
Ο |
||||
|
Netherlands |
222/ |
❚ |
❚ |
Ø |
Ø |
Ο |
● |
(Ø) |
Ο |
||||||
|
United States |
251/ |
Ø |
Ø |
❚ |
❚ |
Ο |
● |
(Ø) |
●
|
||||||
|
United States |
1,032/ |
Ø |
❚ |
❚ |
Ο |
● |
● |
||||||||
Ο = positive association, statistically significant. ● = negative association, statistically significant. ❚ = statistically significant association. Ø = no statistically significant association. (Ø) = no variability in the factor in this study. ▲ = the youngest and the oldest had more symptoms.
Empty box implies that the factor was not included in this study.
1 Matches references in table 52.7.
Source: adapted from Bammer 1990.
Factors not related to work
There is very little evidence that factors not related to work are important causes of these disorders, although there is some evidence that people with a previous injury to the relevant area or with problems in another part of the body may be more likely to develop problems. There is no clear evidence for involvement of age and the one study which examined neuroticism found that it was not related.
Biomechanical factors
There is some evidence that working with certain joints of the body at extreme angles is associated with musculoskeletal problems. The effects of other biomechanical factors are less clear-cut, with some studies finding them to be important and others not. These factors are: assessment of the adequacy of the furniture and/or equipment by the investigators; assessment of the adequacy of the furniture and/or equipment by the workers; visual factors in the workplace, such as glare; personal visual factors, such as the use of spectacles; and years on the job or as an office worker (table 2).
Organizational factors
A number of factors related to work organization are clearly associated with musculoskeletal problems and are discussed more fully elsewhere is this chapter. Factors include: high work pressure, low autonomy (i.e., low levels of control over work), low peer cohesion (i.e., low levels of support from other workers) which may mean that other workers cannot or do not help out in times of pressure, and low task variety.
The only factor which was studied for which results were mixed was hours using a keyboard (table 2). Overall it can be seen that the causes of musculoskeletal problems on the individual level are multifactorial. Work-related factors, particularly work organization, but also biomechanical factors, have a clear role. The specific factors of importance may vary from workplace to workplace and person to person, depending on individual circumstances. For example, the large-scale introduction of wrist rests into a workplace when high pressure and low task variety are hallmarks is unlikely to be a successful strategy. Alternatively, a worker with satisfactory delineation and variety of tasks may still develop problems if the VDU screen is placed at an awkward angle.
The Australian experience, where there was a decline in prevalence of reporting of musculoskeletal problems in the late 1980s, is instructive in indicating how the causes of these problems can be dealt with. Although this has not been documented or researched in detail, it is likely that a number of factors were associated with the decline in prevalence. One is the widespread introduction into workplaces of “ergonomically” designed furniture and equipment. There were also improved work practices including multiskilling and restructuring to reduce pressure and increase autonomy and variety. These often occurred in conjunction with the implementation of equal employment opportunity and industrial democracy strategies. There was also widespread implementation of prevention and early intervention strategies. Less positively, some workplaces seem to have increased their reliance on casual contract workers for repetitive keyboard work. This means that any problems would not be linked to the employer, but would be solely the worker’s responsibility.
In addition, the intensity of the controversy surrounding these problems led to their stigmatization, so that many workers have become more reluctant to report and claim compensation when they develop symptoms. This was further exacerbated when workers lost cases brought against employers in well-publicized legal proceedings. A decrease in research funding, cessation in publication of incidence and prevalence statistics and of research papers about these disorders, as well as greatly reduced media attention to the problem all helped shape a perception that the problem had gone away.
Conclusion
Work-related musculoskeletal problems are a significant problem throughout the world. They represent enormous costs at the individual and social levels. There are no internationally accepted criteria for these disorders and there is a need for an international system of classification. There needs to be an emphasis on prevention and early intervention and this needs to be multifactorial. Ergonomics should be taught at all levels from elementary school to university and there need to be guidelines and laws based on minimum requirements. Implementation requires commitment from employers and active participation from employees (Hagberg et al. 1993).
Despite the many recorded cases of people with severe and chronic problems, there is little available evidence of successful treatments. There is also little evidence of how rehabilitation back into the workforce of workers with these disorders can be most successfully undertaken. This highlights that prevention and early intervention strategies are paramount to the control of work-related musculoskeletal problems.
Skin Problems
The first reports of skin complaints among people working with or near VDUs came from Norway as early as 1981. A few cases have also been reported from the United Kingdom, the United States and Japan. Sweden, however, has provided many case reports and public discussion on the health effects of exposure to VDUs was intensified when one case of skin disease in a VDU worker was accepted as an occupational disease by the Swedish National Insurance Board in late 1985. The acceptance of this case for compensation coincided with a marked increase in the number of cases of skin disease that were suspected to be related to work with VDUs. At the Department of Occupational Dermatology at Karolinska Hospital, Stockholm, the caseload increased from seven cases referred between 1979 and 1985, to 100 new referrals from November 1985 to May 1986.
Despite the relatively large number of people who sought medical treatment for what they believed to be VDU-related skin problems, no conclusive evidence is available which shows that the VDUs themselves lead to the development of occupational skin disease. The occurrence of skin disease in VDU-exposed people appears to be coincidental or possibly related to other workplace factors. Evidence for this conclusion is strengthened by the observation that the increased incidence of skin complaints made by Swedish VDU workers has not been observed in other countries, where the mass media debate on the issue has not been as intense. Further, scientific data collected from provocation studies, in which patients have been purposely exposed to VDU-related electromagnetic fields to determine whether a skin effect could be induced, have not produced any meaningful data demonstrating a possible mechanism for development of skin problems which could be related to the fields surrounding a VDU.
Case Studies: Skin Problems and VDUs
Sweden: 450 patients were referred and examined for skin problems which they attributed to work at VDUs. Only common facial dermatoses were found and no patients had specific dermatoses that could be related to work with VDUs. While most patients felt that they had pronounced symptoms, their visible skin lesions were, in fact, mild according to standard medical definitions and most of the patients reported improvement without drug therapy even though they continued to work with VDUs . Many of the patients were suffering from identifiable contact allergies, which explained their skin symptoms . Epidemiological studies comparing the VDU-work patients to a non-exposed control population with a similar skin status showed no relationship between skin status and VDU work. Finally, a provocation study did not yield any relation between the patient symptoms and electrostatic or magnetic fields from the VDUs (Wahlberg and Lidén 1988; Berg 1988; Lidén 1990; Berg, Hedblad and Erhardt 1990; Swanbeck and Bleeker 1989).In contrast to a few early nonconclusive epidemiological studies (Murray et al. 1981; Frank 1983; Lidén and Wahlberg 1985), a large-scale epidemiological study (Berg, Lidén, and Axelson 1990; Berg 1989) of 3,745 randomly selected office employees, of whom 809 persons were medically examined, showed that while the VDU-exposed employees reported significantly more skin problems than a nonexposed control population of office employees, upon examination, they were not actually found to have no more visible signs or more skin disease.
Wales (UK): A questionnaire study found no difference between reports of skin problems in VDU workers and a control population (Carmichael and Roberts 1992).
Singapore: A control population of teachers reported significantly more skin complaints than did the VDU users (Koh et al. 1991).
It is, however, possible that work-related stress could be an important factor that can explain VDU-associated skin complaints. For example, follow-up studies in the office environment of a subgroup of the VDU-exposed office employees being studied for skin problems showed that significantly more people in the group with skin symptoms experienced extreme occupational stress than people without the skin symptoms. A correlation between levels of the stress-sensitive hormones testosterone, prolactin and thyroxin and skin symptoms were observed during work, but not during days off. Thus, one possible explanation for VDU-associated facial skin sensations could be the effects of thyroxin, which causes the blood vessels to dilate (Berg et al. 1992).
Psychosocial Aspects of VDU Work
Introduction
Computers provide efficiency, competitive advantages and the ability to carry out work processes that would not be possible without their use. Areas such as manufacturing process control, inventory management, records management, complex systems control and office automation have all benefited from automation. Computerization requires substantial infrastructure support in order to function properly. In addition to architectural and electrical changes needed to accommodate the machines themselves, the introduction of computerization requires changes in employee knowledge and skills, and application of new methods of managing work. The demands placed on jobs which use computers can be very different from those of traditional jobs. Often computerized jobs are more sedentary and may require more thinking and mental attention to tasks, while at the same time require less physical energy expenditure. Production demands can be high, with constant work pressure and little room for decision-making.
The economic advantages of computers at work have overshadowed associated potential health, safety and social problems for workers, such as job loss, cumulative trauma disorders and increased mental stress. The transition from more traditional forms of work to computerization has been difficult in many workplaces, and has resulted in significant psychosocial and sociotechnical problems for the workforce.
Psychosocial Problems Specific to VDUs
Research studies (for example, Bradley 1983 and 1989; Bikson 1987; Westlander 1989; Westlander and Aberg 1992; Johansson and Aronsson 1984; Stellman et al. 1987b; Smith et al. 1981 and 1992a) have documented how the introduction of computers into the workplace has brought substantial changes in the process of work, in social relationships, in management style and in the nature and content of job tasks. In the 1980s, the implementation of the technological changeover to computerization was most often a “top-down” process in which employees had no input into the decisions regarding the new technology or the new work structures. As a result, many industrial relations, physical and mental health problems arose.
Experts disagree on the success of changes that are occurring in offices, with some arguing that computer technology improves the quality of work and enhances productivity (Strassmann 1985), while others compare computers to earlier forms of technology, such as assembly-line production that also make working conditions worse and increase job stress (Moshowitz 1986; Zuboff 1988). We believe that visual display unit (VDU) technology does affect work in various ways, but technology is only one element of a larger work system that includes the individual, tasks, environment and organizational factors.
Conceptualizing Computerized Job Design
Many working conditions jointly influence the VDU user. The authors have proposed a comprehensive job design model which illustrates the various facets of working conditions which can interact and accumulate to produce stress (Smith and Carayon-Sainfort 1989). Figure 1 illustrates this conceptual model for the various elements of a work system that can exert loads on workers and may result in stress. At the centre of this model is the individual with his/her unique physical characteristics, perceptions, personality and behaviour. The individual uses technologies to perform specific job tasks. The nature of the technologies, to a large extent, determines performance and the skills and knowledge needed by the worker to use the technology effectively. The requirements of the task also affect the required skill and knowledge levels needed. Both the tasks and technologies affect the job content and the mental and physical demands. The model also shows that the tasks and technologies are placed within the context of a work setting that comprises the physical and the social environment. The overall environment itself can affect comfort, psychological moods and attitudes. Finally, the organizational structure of work defines the nature and level of individual involvement, worker interactions, and levels of control. Supervision and standards of performance are all affected by the nature of the organization.
Figure 1. Model of working conditions and their impact on the individual
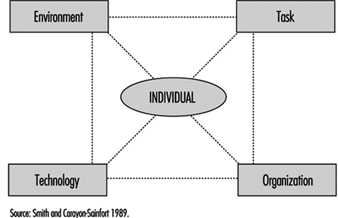
This model helps to explain relationships between job requirements, psychological and physical loads and resulting health strains. It represents a systems concept in which any one element can influence any other element, and in which all elements interact to determine the way in which work is accomplished and the effectiveness of the work in achieving individual and organizational needs and goals. The application of the model to the VDU workplace is described below.
Environment
Physical environmental factors have been implicated as job stressors in the office and elsewhere. General air quality and housekeeping contribute, for example, to sick building syndrome and other stress responses (Stellman et al. 1985; Hedge, Erickson and Rubin 1992.) Noise is a well-known environmental stressor which can cause increases in arousal, blood pressure, and negative psychological mood (Cohen and Weinstein 1981). Environmental conditions that produce sensory disruption and make it more difficult to carry out tasks increase the level of worker stress and emotional irritation are other examples (Smith et al. 1981; Sauter et al. 1983b).
Task
With the introduction of computer technology, expectations regarding performance increase. Additional pressure on workers is created because they are expected to perform at a higher level all the time. Excessive workload and work pressure are significant stressors for computer users (Smith et al. 1981; Piotrkowski, Cohen and Coray 1992; Sainfort 1990). New types of work demands are appearing with the increasing use of computers. For instance, cognitive demands are likely to be sources of increased stress for VDU users (Frese 1987). These are all facets of job demands.
Electronic Monitoring of Employee Performance
The use of electronic methods to monitor employee work performance has increased substantially with the widespread use of personal computers which make such monitoring quick and easy. Monitoring provides information which can be used by employers to better manage technological and human resources. With electronic monitoring it is possible to pinpoint bottlenecks, production delays and below average (or below standard) performance of employees in real time. New electronic communication technologies have the capability of tracking the performance of individual elements of a communication system and of pinpointing individual worker inputs. Such work elements as data entry into computer terminals, telephone conversations, and electronic mail messages can all be examined through the use of electronic surveillance.
Electronic monitoring increases management control over the workforce, and may lead to organisational management approaches that are stressful. This raises important issues about the accuracy of the monitoring system and how well it represents worker contributions to the employer’s success, the invasion of worker privacy, worker versus technology control over job tasks, and the implications of management styles that use monitored information to direct worker behaviour on the job (Smith and Amick 1989; Amick and Smith 1992; Carayon 1993b). Monitoring can bring about increased production, but it may also produce job stress, absences from work, turnover in the workforce and sabotage. When electronic monitoring is combined with incentive systems for increased production, work-related stress can also be increased (OTA 1987; Smith et al. 1992a). In addition, such electronic performance monitoring raises issues of worker privacy (ILO 1991) and several countries have banned the use of individual performance monitoring.
A basic requirement of electronic monitoring is that work tasks be broken up into activities that can easily be quantified and measured, which usually results in a job design approach that reduces the content of the tasks by removing complexity and thinking, which are replaced by repetitive action. The underlying philosophy is similar to a basic principle of “Scientific Management” (Taylor 1911) that calls for work “simplification.”
In one company, for example, a telephone monitoring capability was included with a new telephone system for customer service operators. The monitoring system distributed incoming telephone calls from customers, timed the calls and allowed for supervisor eavesdropping on employee telephone conversations. This system was instituted under the guise of a work flow scheduling tool for determining the peak periods for telephone calls to determine when extra operators would be needed. Instead of using the monitoring system solely for that purpose, management also used the data to establish work performance standards, (seconds per transaction) and to bring disciplinary action against employees with “below average performance.” This electronic monitoring system introduced a pressure to perform above average because of fear of reprimand. Research has shown that such work pressure is not conducive to good performance but rather can bring about adverse health consequences (Cooper and Marshall 1976; Smith 1987). In fact, the monitoring system described was found to have increased employee stress and lowered the quality of production (Smith et al. 1992a).
Electronic monitoring can influence worker self-image and feelings of self-worth. In some cases, monitoring could enhance feelings of self-worth if the worker gets positive feedback. The fact that management has taken an interest in the worker as a valuable resource is another possible positive outcome. However, both effects may be perceived differently by workers, particularly if poor performance leads to punishment or reprimand. Fear of negative evaluation can produce anxiety and may damage self-esteem and self-image. Indeed electronic monitoring can create known adverse working conditions, such as paced work, lack of worker involvement, reduced task variety and task clarity, reduced peer social support, reduced supervisory support, fear of job loss, or routine work activities, and lack of control over tasks (Amick and Smith 1992; Carayon 1993).
Michael J. Smith
Positive aspects also exist since computers are able to do many of the simple, repetitive tasks that were previously done manually, which can reduce the repetitiveness of the job, increase the content of the job and make it more meaningful. This is not universally true, however, since many new computer jobs, such as data entry, are still repetitive and boring. Computers can also provide performance feedback that is not available with other technologies (Kalimo and Leppanen 1985), which can reduce ambiguity.
Some aspects of computerized work have been linked to decreased control, which has been identified as a major source of stress for clerical computer users. Uncertainty regarding the duration of computer-related problems, such as breakdown and slowdown, can be a source of stress (Johansson and Aronsson 1984; Carayon-Sainfort 1992). Computer-related problems can be particularly stressful if workers, such as airline reservation clerks, are highly dependent on the technology to perform their job.
Technology
The technology being used by the worker often defines his or her ability to accomplish tasks and the extent of physiological and psychological load. If the technology produces either too much or too little workload, increased stress and adverse physical health outcomes can occur (Smith et al. 1981; Johansson and Aronsson 1984; Ostberg and Nilsson 1985). Technology is changing at a rapid pace, forcing workers to adjust their skills and knowledge continuously to keep up. In addition, today’s skills can quickly become obsolete. Technological obsolescence may be due to job de-skilling and impoverished job content or to inadequate skills and training. Workers who do not have the time or resources to keep up with the technology may feel threatened by the technology and may worry about losing their job. Thus, workers’ fears of having inadequate skills to use the new technology are one of the main adverse influences of technology, which training, of course, can help to offset. Another effect of the introduction of technology is the fear of job loss due to increased efficiency of technology (Ostberg and Nilsson 1985; Smith, Carayon and Miezio 1987).
Intensive, repetitive, long sessions at the VDU can also contribute to increased ergonomic stress and strain (Stammerjohn, Smith and Cohen 1981; Sauter et al. 1983b; Smith et al. 1992b) and can create visual or musculoskeletal discomfort and disorders, as described elsewhere in the chapter.
Organizational factors
The organizational context of work can influence worker stress and health. When technology requires new skills, the way in which workers are introduced to the new technology and the organizational support they receive, such as appropriate training and time to acclimatize, has been related to the levels of stress and emotional disturbances experienced (Smith, Carayon and Miezio 1987). The opportunity for growth and promotion in a job (career development) is also related to stress (Smith et al. 1981). Job future uncertainty is a major source of stress for computer users (Sauter et al. 1983b; Carayon 1993a) and the possibility of job loss also creates stress (Smith et al. 1981; Kasl 1978).
Work scheduling, such as shift work and overtime, have been shown to have negative mental and physical health consequences (Monk and Tepas 1985; Breslow and Buell 1960). Shift work is increasingly used by companies that want or need to keep computers running continuously. Overtime is often needed to ensure that workers keep up with the workload, especially when work remains incomplete as a result of delays due to computer breakdown or misfunction.
Computers provide management with the capability to continuously monitor employee performance electronically, which has the potential to create stressful working conditions, such as by increasing work pressure (see the box “Electronic Monitoring”). Negative employee-supervisor relationships and feelings of lack of control can increase in electronically supervised workplaces.
The introduction of VDU technology has affected social relationships at work. Social isolation has been identified as a major source of stress for computer users (Lindström 1991; Yang and Carayon 1993) since the increased time spent working on computers reduces the time that workers have to socialize and receive or give social support. The need for supportive supervisors and co-workers has been well documented (House 1981). Social support can moderate the impact of other stressors on worker stress. Thus, support from colleagues, supervisor or computer staff becomes important for the worker who is experiencing computer-related problems but the computer work environment may, ironically, reduce the level of such social support available.
The individual
A number of personal factors such as personality, physical health status, skills and abilities, physical conditioning, prior experiences and learning, motives, goals and needs determine the physical and psychological effects just described (Levi 1972).
Improving the Psychosocial Characteristics of VDU Work
The first step in making VDU work less stressful is to identify work organization and job design features that can promote psychosocial problems so that they can be modified, always bearing in mind that VDU problems which can lead to job stress are seldom the result of single aspects of the organization or of job design, but rather, are a combination of many aspects of improper work design. Thus, solutions for reducing or eliminating job stress must be comprehensive and deal with many improper work design factors simultaneously. Solutions that focus on only one or two factors will not succeed. (See figure 2.)
Figure 2. Keys to reducing isolation and stress
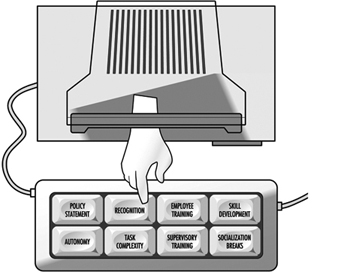
Improvements in job design should start with the work organization providing a supportive environment for employees. Such an environment enhances employee motivation to work and feelings of security, and it reduces feelings of stress (House 1981). A policy statement that defines the importance of employees within an organization and is explicit on how the organization will provide a supportive environment is a good first step. One very effective means for providing support to employees is to provide supervisors and managers with specific training in methods for being supportive. Supportive supervisors can serve as buffers that “protect” employees from unnecessary organizational or technological stresses.
The content of job tasks has long been recognized as important for employee motivation and productivity (Herzberg 1974; Hackman and Oldham 1976). More recently the relationship between job content and job stress reactions has been elucidated (Cooper and Marshall 1976; Smith 1987). Three main aspects of job content that are of specific relevance to VDU work are task complexity, employee skills and career opportunities. In some respects, these are all related to the concept of developing the motivational climate for employee job satisfaction and psychological growth, which deals with the improvement of employees’ intellectual capabilities and skills, increased ego enhancement or self-image and increased social group recognition of individual achievement.
The primary means for enhancing job content is to increase the skill level for performing job tasks, which typically means enlarging the scope of job tasks, as well as enriching the elements of each specific task (Herzberg 1974). Enlarging the number of tasks increases the repertoire of skills needed for successful task performance, and also increases the number of employee decisions made while defining task sequences and activities. An increase in the skill level of the job content promotes employee self-image of personal worth and of value to the organization. It also enhances the positive image of the individual in his or her social work group within the organization.
Increasing the complexity of the tasks, which means increasing the amount of thinking and decision-making involved, is a logical next step that can be achieved by combining simple tasks into sets of related activities that have to be coordinated, or by adding mental tasks that require additional knowledge and computational skills. Specifically, when computerized technology is introduced, new tasks in general will have requirements that exceed the current knowledge and skills of the employees who are to perform them. Thus there is a need to train employees in the new aspects of the tasks so that they will have the skills to perform the tasks adequately. Such training has more than one benefit, since it not only may improve employee knowledge and skills, and thus enhance performance, but may also enhance employee self-esteem and confidence. Providing training also shows the employee that the employer is willing to invest in his or her skill enhancement, and thus promotes confidence in employment stability and job future.
The amount of control that an employee has over the job has a powerful psychosocial influence (Karasek et al. 1981; Sauter, Cooper and Hurrell 1989). Important aspects of control can be defined by the answers to the questions, “What, how and when?” The nature of the tasks to be undertaken, the need for coordination among employees, the methods to be used to carry out the tasks and the scheduling of the tasks can all be defined by answers to these questions. Control can be designed into jobs at the levels of the task, the work unit and the organization (Sainfort 1991; Gardell 1971). At the task level, the employee can be given autonomy in the methods and procedures used in completing the task.
At the work-unit level, groups of employees can self-manage several interrelated tasks and the group itself can decide on who will perform particular tasks, the scheduling of tasks, coordination of tasks and production standards to meet organizational goals. At the organization level, employees can participate in structured activities that provide input to management about employee opinions or quality improvement suggestions. When the levels of control available are limited, it is better to introduce autonomy at the task level and then work up the organizational structure, insofar as possible (Gardell 1971).
One natural result of computer automation appears to be an increased workload, since the purpose of the automation is to enhance the quantity and quality of work output. Many organizations believe that such an increase is necessary in order to pay for the investment in the automation. However, establishing the appropriate workload is problematic. Scientific methods have been developed by industrial engineers for determining appropriate work methods and workloads (the performance requirements of jobs). Such methods have been used successfully in manufacturing industries for decades, but have had little application in office settings, even after office computerization. The use of scientific means, such as those described by Kanawaty (1979) and Salvendy (1992), to establish workloads for VDU operators, should be a high priority for every organization, since such methods set reasonable production standards or work output requirements, help to protect employees from excessive workloads, as well as help to ensure the quality of products.
The demand that is associated with the high levels of concentration required for computerized tasks can diminish the amount of social interaction during work, leading to social isolation of employees. To counter this effect, opportunities for socialization for employees not engaged in computerized tasks, and for employees who are on rest breaks, should be provided. Non-computerized tasks which do not require extensive concentration could be organized in such a way that employees can work in close proximity to one another and thus have the opportunity to talk among themselves. Such socialization provides social support, which is known to be an essential modifying factor in reducing adverse mental health effects and physical disorders such as cardiovascular diseases (House 1981). Socialization naturally also reduces social isolation and thus promotes improved mental health.
Since poor ergonomic conditions can also lead to psychosocial problems for VDU users, proper ergonomic conditions are an essential element of complete job design. This is covered in some detail in other articles in this chapter and elsewhere in the Encyclopaedia.
Finding Balance
Since there are no “perfect” jobs or “perfect” workplaces free from all psychosocial and ergonomic stressors, we must often compromise when making improvements at the workplace. Redesigning processes generally involves “trade-offs” between excellent working conditions and the need to have acceptable productivity. This requires us to think about how to achieve the best “balance” between positive benefits for employee health and productivity. Unfortunately, since so many factors can produce adverse psychosocial conditions that lead to stress, and since these factors are interrelated, modifications in one factor may not be beneficial if concomitant changes are not made in other related factors. In general, two aspects of balance should be addressed: the balance of the total system and compensatory balance.
System balance is based on the idea that a workplace or process or job is more than the sum of the individual components of the system. The interplay among the various components produces results that are greater (or less) than the sum of the individual parts and determines the potential for the system to produce positive results. Thus, job improvements must take account of and accommodate the entire work system. If an organization concentrates solely on the technological component of the system, there will be an imbalance because personal and psychosocial factors will have been neglected. The model given in figure 1 of the work system can be used to identify and understand the relationships between job demands, job design factors, and stress which must be balanced.
Since it is seldom possible to eliminate all psychosocial factors that cause stress, either because of financial considerations, or because it is impossible to change inherent aspects of job tasks, compensatory balance techniques are employed. Compensatory balance seeks to reduce psychological stress by changing aspects of work that can be altered in a positive direction to compensate for those aspects that cannot be changed. Five elements of the work system—physical loads, work cycles, job content, control, and socialization—function in concert to provide the resources for achieving individual and organizational goals through compensatory balance. While we have described some of the potential negative attributes of these elements in terms of job stress, each also has positive aspects that can counteract the negative influences. For instance, inadequate skill to use new technology can be offset by employee training. Low job content that creates repetition and boredom can be balanced by an organizational supervisory structure that promotes employee involvement and control over tasks, and job enlargement that introduces task variety. The social conditions of VDU work could be improved by balancing the loads that are potentially stressful and by considering all of the work elements and their potential for promoting or reducing stress. The organizational structure itself could be adapted to accommodate enriched jobs in order to provide support to the individual. Increased staffing levels, increasing the levels of shared responsibilities or increasing the financial resources put toward worker well-being are other possible solutions.
More...
Ergonomic Aspects of Human-Computer Interaction
Introduction
The development of effective interfaces to computer systems is the fundamental objective of research on human-computer interactions.
An interface can be defined as the sum of the hardware and software components through which a system is operated and users informed of its status. The hardware components include data entry and pointing devices (e.g., keyboards, mice), information-presentation devices (e.g., screens, loudspeakers), and user manuals and documentation. The software components include menu commands, icons, windows, information feedback, navigation systems and messages and so on. An interface’s hardware and software components may be so closely linked as to be inseparable (e.g., function keys on keyboards). The interface includes everything the user perceives, understands and manipulates while interacting with the computer (Moran 1981). It is therefore a crucial determinant of the human-machine relation.
Research on interfaces aims at improving interface utility, accessibility, performance and safety, and usability. For these purposes, utility is defined with reference to the task to be performed. A useful system contains the necessary functions for the completion of tasks users are asked to perform (e.g., writing, drawing, calculations, programming). Accessibility is a measure of an interface’s ability to allow several categories of users—particularly individuals with handicaps, and those working in geographically isolated areas, in constant movement or having both hands occupied—to use the system to perform their activities. Performance, considered here from a human rather than a technical viewpoint, is a measure of the degree to which a system improves the efficiency with which users perform their work. This includes the effect of macros, menu short-cuts and intelligent software agents. The safety of a system is defined by the extent to which an interface allows users to perform their work free from the risk of human, equipment, data, or environmental accidents or losses. Finally, usability is defined as the ease with which a system is learned and used. By extension, it also includes system utility and performance, defined above.
Elements of Interface Design
Since the invention of shared-time operating systems in 1963, and especially since the arrival of the microcomputer in 1978, the development of human-computer interfaces has been explosive (see Gaines and Shaw 1986 for a history). The stimulus for this development has been essentially driven by three factors acting simultaneously:
First, the very rapid evolution of computer technology, a result of advances in electrical engineering, physics and computer science, has been a major determinant of user interface development. It has resulted in the appearance of computers of ever-increasing power and speed, with high memory capacities, high-resolution graphics screens, and more natural pointing devices allowing direct manipulation (e.g., mice, trackballs). These technologies were also responsible for the emergence of microcomputing. They were the basis for the character-based interfaces of the 1960s and 1970s, graphical interfaces of the late 1970s, and multi- and hyper-media interfaces appearing since the mid-1980s based on virtual environments or using a variety of alternate-input recognition technologies (e.g., voice-, handwriting-, and movement-detection). Considerable research and development has been conducted in recent years in these areas (Waterworth and Chignel 1989; Rheingold 1991). Concomitant with these advances was the development of more advanced software tools for interface design (e.g., windowing systems, graphical object libraries, prototyping systems) that greatly reduce the time required to develop interfaces.
Second, users of computer systems play a large role in the development of effective interfaces. There are three reasons for this. First, current users are not engineers or scientists, in contrast to users of the first computers. They therefore demand systems that can be easily learned and used. Second, the age, sex, language, culture, training, experience, skill, motivation and interest of individual users is quite varied. Interfaces must therefore be more flexible and better able to adapt to a range of needs and expectations. Finally, users are employed in a variety of economic sectors and perform a quite diverse spectrum of tasks. Interface developers must therefore constantly reassess the quality of their interfaces.
Lastly, intense market competition and increased safety expectations favour the development of better interfaces. These preoccupations are driven by two sets of partners: on the one hand, software producers who strive to reduce their costs while maintaining product distinctiveness that furthers their marketing goals, and on the other, users for whom the software is a means of offering competitive products and services to clients. For both groups, effective interfaces offer a number of advantages:
For software producers:
- better product image
- increased demand for products
- shorter training times
- lower after-sales service requirements
- solid base upon which to develop a product line
- reduction of the risk of errors and accidents
- reduction of documentation.
For users:
- shorter learning phase
- increased general applicability of skills
- improved use of the system
- increased autonomy using the system
- reduction of the time needed to execute a task
- reduction in the number of errors
- increased satisfaction.
Effective interfaces can significantly improve the health and productivity of users at the same time as they improve the quality and reduce the cost of their training. This, however, requires basing interface design and evaluation on ergonomic principles and practice standards, be they guidelines, corporate standards of major system manufacturers or international standards. Over the years, an impressive body of ergonomic principles and guidelines related to interface design has accumulated (Scapin 1986; Smith and Mosier 1986; Marshall, Nelson and Gardiner 1987; Brown 1988). This multidisciplinary corpus covers all aspects of character-mode and graphical interfaces, as well as interface evaluation criteria. Although its concrete application occasionally poses some problems—for example, imprecise terminology, inadequate information on usage conditions, inappropriate presentation—it remains a valuable resource for interface design and evaluation.
In addition, the major software manufacturers have developed their own guidelines and internal standards for interface design. These guidelines are available in the following documents:
- Apple Human Interface Guidelines (1987)
- Open Look (Sun 1990)
- OSF/Motif Style Guide (1990)
- IBM Common User Access guide to user interface design (1991)
- IBM Advanced Interface Design Reference (1991)
- The Windows interface: An application design guide (Microsoft 1992)
These guidelines attempt to simplify interface development by mandating a minimal level of uniformity and consistency between interfaces used on the same computer platform. They are precise, detailed, and quite comprehensive in several respects, and offer the additional advantages of being well-known, accessible and widely used. They are the de facto design standards used by developers, and are, for this reason, indispensable.
Furthermore, the International Organization for Standardization (ISO) standards are also very valuable sources of information about interface design and evaluation. These standards are primarily concerned with ensuring uniformity across interfaces, regardless of platforms and applications. They have been developed in collaboration with national standardization agencies, and after extensive discussion with researchers, developers and manufacturers. The main ISO interface design standard is ISO 9241, which describes ergonomic requirements for visual display units. It is comprised of 17 parts. For example, parts 14, 15, 16 and 17 discuss four types of human-computer dialogue—menus, command languages, direct manipulation, and forms. ISO standards should take priority over other design principles and guidelines. The following sections discuss the principles which should condition interface design.
A Design Philosophy Focused on the User
Gould and Lewis (1983) have proposed a design philosophy focused on the video display unit user. Its four principles are:
- Immediate and continuous attention to users. Direct contact with users is maintained, in order to better understand their characteristics and tasks.
- Integrated design. All aspects of usability (e.g., interface, manuals, help systems) are developed in parallel and placed under centralized control.
- Immediate and continuous evaluation by users. Users test the interfaces or prototypes early on in the design phase, under simulated work conditions. Performance and reactions are measured quantitatively and qualitatively.
- Iterative design. The system is modified on the basis of the results of the evaluation, and the evaluation cycle started again.
These principles are explained in further detail in Gould (1988). Very relevant when they were first published in 1985, fifteen years later they remain so, due to the inability to predict the effectiveness of interfaces in the absence of user testing. These principles constitute the heart of user-based development cycles proposed by several authors in recent years (Gould 1988; Mantei and Teorey 1989; Mayhew 1992; Nielsen 1992; Robert and Fiset 1992).
The rest of this article will analyse five stages in the development cycle that appear to determine the effectiveness of the final interface.
Task Analysis
Ergonomic task analysis is one of the pillars of interface design. Essentially, it is the process by which user responsibilities and activities are elucidated. This in turn allows interfaces compatible with the characteristics of users’ tasks to be designed. There are two facets to any given task:
- The nominal task, corresponding to the organization’s formal definition of the task. This includes objectives, procedures, quality control, standards and tools.
- The real task, corresponding to the users’ decisions and behaviours necessary for the execution of the nominal task.
The gap between nominal and real tasks is inevitable and results from the failure of nominal tasks to take into account variations and unforeseen circumstances in the work flow, and differences in users’ mental representations of their work. Analysis of the nominal task is insufficient for a full understanding of users’ activities.
Activity analysis examines elements such as work objectives, the type of operations performed, their temporal organization (sequential, parallel) and frequency, the operational modes relied upon, decisions, sources of difficulty, errors and recovery modes. This analysis reveals the different operations performed to accomplish the task (detection, searching, reading, comparing, evaluating, deciding, estimating, anticipating), the entities manipulated (e.g., in process control, temperature, pressure, flow-rate, volume) and the relation between operators and entities. The context in which the task is executed conditions these relations. These data are essential for the definition and organization of the future system’s features.
At its most basic, task analysis is composed of data collection, compilation and analysis. It may be performed before, during or after computerization of the task. In all cases, it provides essential guidelines for interface design and evaluation. Task analysis is always concerned with the real task, although it may also study future tasks through simulation or prototype testing. When performed prior to computerization, it studies “external tasks” (i.e., tasks external to the computer) performed with the existing work tools (Moran 1983). This type of analysis is useful even when computerization is expected to result in major modification of the task, since it elucidates the nature and logic of the task, work procedures, terminology, operators and tasks, work tools and sources of difficulty. In so doing, it provides the data necessary for task optimization and computerization.
Task analysis performed during task computerization focuses on “internal tasks”, as performed and represented by the computer system. System prototypes are used to collect data at this stage. The focus is on the same points examined in the previous stage, but from the point of view of the computerization process.
Following task computerization, task analysis also studies internal tasks, but analysis now focuses on the final computer system. This type of analysis is often performed to evaluate existing interfaces or as part of the design of new ones.
Hierarchical task analysis is a common method in cognitive ergonomics that has proven very useful in a wide variety of fields, including interface design (Shepherd 1989). It consists of the division of tasks (or main objectives) into sub-tasks, each of which can be further subdivided, until the required level of detail is attained. If data is collected directly from users (e.g., through interviews, vocalization), hierarchical division can provide a portrait of users’ mental mapping of a task. The results of the analysis can be represented by a tree diagram or table, each format having its advantages and disadvantages.
User Analysis
The other pillar of interface design is the analysis of user characteristics. The characteristics of interest may relate to user age, sex, language, culture, training, technical or computer-related knowledge, skills or motivation. Variations in these individual factors are responsible for differences within and between groups of users. One of the key tenets of interface design is therefore that there is no such thing as the average user. Instead, different groups of users should be identified and their characteristics understood. Representatives of each group should be encouraged to participate in the interface design and evaluation processes.
On the other hand, techniques from psychology, ergonomics and cognitive engineering can be used to reveal information on user characteristics related to perception, memory, cognitive mapping, decision-making and learning (Wickens 1992). It is clear that the only way to develop interfaces that are truly compatible with users is to take into account the effect of differences in these factors on user capacities, limits and ways of operating.
Ergonomic studies of interfaces have focused almost exclusively on users’ perceptual, cognitive and motor skills, rather than on affective, social or attitudinal factors, although work in the latter fields has become more popular in recent years. (For an integrated view of humans as information-processing systems see Rasmussen 1986; for a review of user-related factors to consider when designing interfaces see Thimbleby 1990 and Mayhew 1992). The following paragraphs review the four main user-related characteristics that should be taken into account during interface design.
Mental representation
The mental models users construct of the systems they use reflect the manner in which they receive and understand these systems. These models therefore vary as a function of users’ knowledge and experience (Hutchins 1989). In order to minimize the learning curve and facilitate system use, the conceptual model upon which a system is based should be similar to users’ mental representation of it. It should be recognized however that these two models are never identical. The mental model is characterized by the very fact that it is personal (Rich 1983), incomplete, variable from one part of the system to another, possibly in error on some points and in constant evolution. It plays a minor role in routine tasks but a major one in non-routine ones and during diagnosis of problems (Young 1981). In the latter cases, users will perform poorly in the absence of an adequate mental model. The challenge for interface designers is to design systems whose interaction with users will induce the latter to form mental models similar to the system’s conceptual model.
Learning
Analogy plays a large role in user learning (Rumelhart and Norman 1983). For this reason, the use of appropriate analogies or metaphors in the interface facilitates learning, by maximizing the transfer of knowledge from known situations or systems. Analogies and metaphors play a role in many parts of the interface, including the names of commands and menus, symbols, icons, codes (e.g., shape, colour) and messages. When pertinent, they greatly contribute to rendering interfaces natural and more transparent to users. On the other hand, when they are irrelevant, they can hinder users (Halasz and Moran 1982). To date, the two metaphors used in graphical interfaces are the desktop and, to a lesser extent, the room.
Users generally prefer to learn new software by using it immediately rather than by reading or taking a course—they prefer action-based learning in which they are cognitively active. This type of learning does, however, present a few problems for users (Carroll and Rosson 1988; Robert 1989). It demands an interface structure which is compatible, transparent, consistent, flexible, natural-appearing and fault tolerant, and a feature set which ensures usability, feedback, help systems, navigational aides and error handling (in this context, “errors” refer to actions that users wish to undo). Effective interfaces give users some autonomy during exploration.
Developing knowledge
User knowledge develops with increasing experience, but tends to plateau rapidly. This means that interfaces must be flexible and capable of responding simultaneously to the needs of users with different levels of knowledge. Ideally, they should also be context sensitive and provide personalized help. The EdCoach system, developed by Desmarais, Giroux and Larochelle (1993) is such an interface. Classification of users into beginner, intermediate and expert categories is inadequate for the purpose of interface design, since these definitions are too static and do not account for individual variations. Information technology capable of responding to the needs of different types of users is now available, albeit at the research, rather than commercial, level (Egan 1988). The current rage for performance-support systems suggests intense development of these systems in coming years.
Unavoidable errors
Finally, it should be recognized that users make mistakes when using systems, regardless of their skill level or the quality of the system. A recent German study by Broadbeck et al. (1993) revealed that at least 10% of the time spent by white-collar workers working on computers is related to error management. One of the causes of errors is users’ reliance on correction rather than prevention strategies (Reed 1982). Users prefer acting rapidly and incurring errors that they must subsequently correct, to working more slowly and avoiding errors. It is essential that these considerations be taken into account when designing human-computer interfaces. In addition, systems should be fault tolerant and should incorporate effective error management (Lewis and Norman 1986).
Needs Analysis
Needs analysis is an explicit part of Robert and Fiset’s development cycle (1992), it corresponds to Nielsen’s functional analysis and is integrated into other stages (task, user or needs analysis) described by other authors. It consists of the identification, analysis and organization of all the needs that the computer system can satisfy. Identification of features to be added to the system occurs during this process. Task and user analysis, presented above, should help define many of the needs, but may prove inadequate for the definition of new needs resulting from the introduction of new technologies or new regulations (e.g., safety). Needs analysis fills this void.
Needs analysis is performed in the same way as functional analysis of products. It requires the participation of a group of people interested by the product and possessing complementary training, occupations or work experience. This can include future users of the system, supervisors, domain experts and, as required, specialists in training, work organization and safety. Review of the scientific and technical literature in the relevant field of application may also be performed, in order to establish the current state of the art. Competitive systems used in similar or related fields can also be studied. The different needs identified by this analysis are then classified, weighted and presented in a format appropriate for use throughout the development cycle.
Prototyping
Prototyping is part of the development cycle of most interfaces and consists of the production of a preliminary paper or electronic model (or prototype) of the interface. Several books on the role of prototyping in human-computer interaction are available (Wilson and Rosenberg 1988; Hartson and Smith 1991; Preece et al. 1994).
Prototyping is almost indispensable because:
- Users have difficulty evaluating interfaces on the basis of functional specifications—the description of the interface is too distant from the real interface, and evaluation too abstract. Prototypes are useful because they allow users to see and use the interface and directly evaluate its usefulness and usability.
- It is practically impossible to construct an adequate interface on the first try. Interfaces must be tested by users and modified, often repeatedly. To overcome this problem, paper or interactive prototypes that can be tested, modified or rejected are produced and refined until a satisfactory version is obtained. This process is considerably less expensive than working on real interfaces.
From the point of view of the development team, prototyping has several advantages. Prototypes allow the integration and visualization of interface elements early on in the design cycle, rapid identification of detailed problems, production of a concrete and common object of discussion in the development team and during discussions with clients, and simple illustration of alternative solutions for the purposes of comparison and internal evaluation of the interface. The most important advantage is, however, the possibility of having users evaluate prototypes.
Inexpensive and very powerful software tools for the production of prototypes are commercially available for a variety of platforms, including microcomputers (e.g., Visual Basic and Visual C++ (™Microsoft Corp.), UIM/X (™Visual Edge Software), HyperCard (™Apple Computer), SVT (™SVT Soft Inc.)). Readily available and relatively easy to learn, they are becoming widespread among system developers and evaluators.
The integration of prototyping completely changed the interface development process. Given the rapidity and flexibility with which prototypes can be produced, developers now tend to reduce their initial analyses of task, users and needs, and compensate for these analytical deficiencies by adopting longer evaluation cycles. This assumes that usability testing will identify problems and that it is more economical to prolong evaluation than to spend time on preliminary analysis.
Evaluation of Interfaces
User evaluation of interfaces is an indispensable and effective way to improve interfaces’ usefulness and usability (Nielsen 1993). The interface is almost always evaluated in electronic form, although paper prototypes may also be tested. Evaluation is an iterative process and is part of the prototype evaluation-modification cycle which continues until the interface is judged acceptable. Several cycles of evaluation may be necessary. Evaluation may be performed in the workplace or in usability laboratories (see the special edition of Behaviour and Information Technology (1994) for a description of several usability laboratories).
Some interface evaluation methods do not involve users; they may be used as a complement to user evaluation (Karat 1988; Nielsen 1993; Nielsen and Mack 1994). A relatively common example of such methods consists of the use of criteria such as compatibility, consistency, visual clarity, explicit control, flexibility, mental workload, quality of feedback, quality of help and error handling systems. For a detailed definition of these criteria, see Bastien and Scapin (1993); they also form the basis of an ergonomic questionnaire on interfaces (Shneiderman 1987; Ravden and Johnson 1989).
Following evaluation, solutions must be found to problems that have been identified, modifications discussed and implemented, and decisions made concerning whether a new prototype is necessary.
Conclusion
This discussion of interface development has highlighted the major stakes and broad trends in the field of human-computer interaction. In summary, (a) task, user, and needs analysis play an essential role in understanding system requirements and, by extension, necessary interface features; and (b) prototyping and user evaluation are indispensable for the determination of interface usability. An impressive body of knowledge, composed of principles, guidelines and design standards, exists on human-computer interactions. Nevertheless, it is currently impossible to produce an adequate interface on the first try. This constitutes a major challenge for the coming years. More explicit, direct and formal links must be established between analysis (task, users, needs, context) and interface design. Means must also be developed to apply current ergonomic knowledge more directly and more simply to the design of interfaces.
Ergonomics Standards
Introduction
Ergonomics standards can take many forms, such as regulations which are promulgated on a national level, or guidelines and standards instituted by international organizations. They play an important role in improving the usability of systems. Design and performance standards give managers confidence that the systems they buy will be capable of being used productively, efficiently, safely and comfortably. They also provide users with a benchmark by which to judge their own working conditions. In this article we focus on the International Organization for Standardization (ISO) ergonomics standard 9241 (ISO 1992) because it provides important, internationally recognized, criteria for selecting or designing VDU equipment and systems. ISO carries out its work through a series of technical committees, one of which is ISO TC 159 SC4 Ergonomics of Human System Interaction Committee, which is responsible for ergonomics standards for situations in which human beings and technological systems interact. Its members are representatives of the national standards bodies of member countries and meetings involve national delegations in discussing and voting on resolutions and technical documents. The primary technical work of the committee takes place in eight Working Groups (WGs), each of which has responsibility for different work items listed in figure 1. This sub-committee has developed ISO 9241.
Figure 1. Technical Working Groups of the Ergonomics of Human System Interaction Technical Committee (ISO TC 159 SC4). ISO 9241: Five working groups broke down the “parts” of the standard to those listed below. This illustration shows the correspondence between the parts of the standard and the various aspects of the workstation with which they are concerned
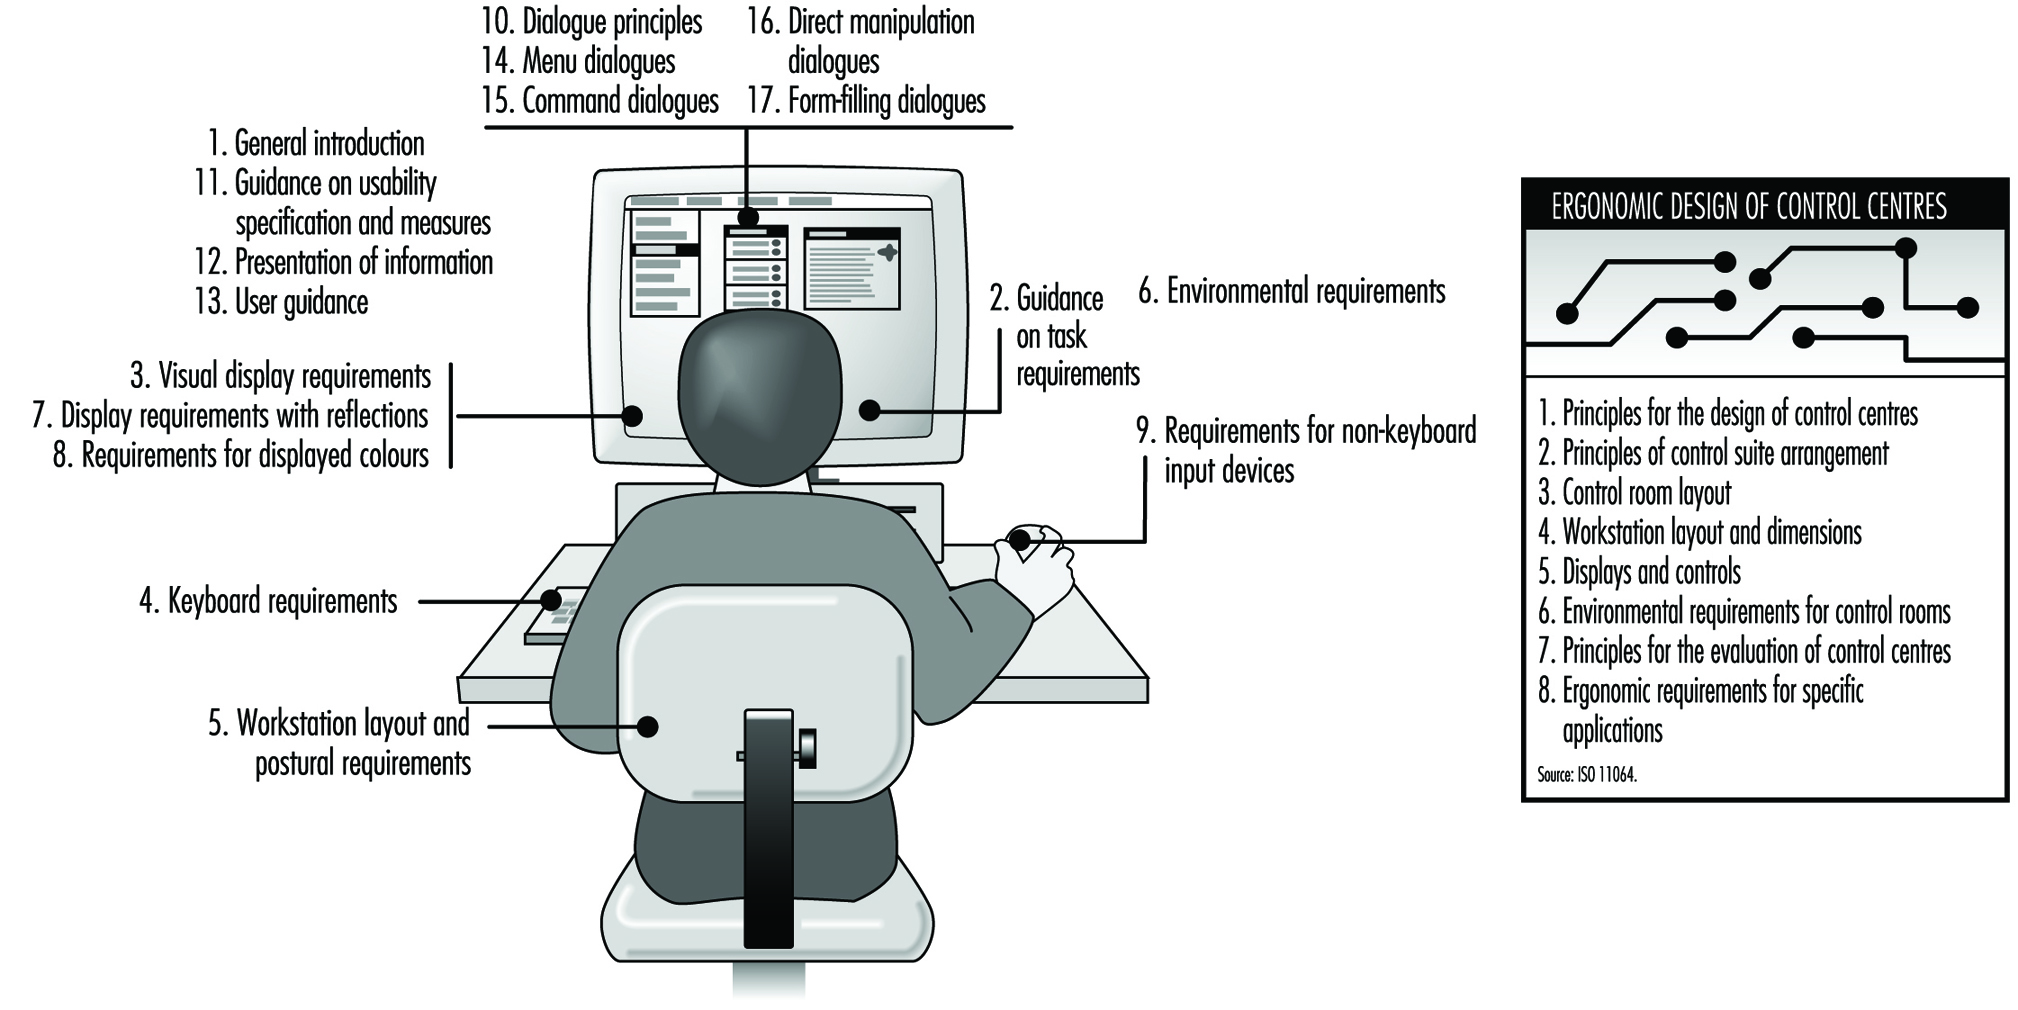 The work of the ISO has major international importance. Leading manufacturers pay great heed to ISO specifications. Most producers of VDUs are international corporations. It is obvious that the best and most effective solutions to workplace design problems from the international manufacturers’ point of view should be agreed upon internationally. Many regional authorities, such as the European Standardization Organization (CEN) have adopted ISO standards wherever appropriate. The Vienna Agreement, signed by the ISO and CEN, is the official instrument which ensures effective collaboration between the two organizations. As different parts of ISO 9241 are approved and published as international standards, they are adopted as European standards and become part of EN 29241. Since CEN standards replace national standards in the European Union (EU) and the European Free Trade Agreement (EFTA) Member States, the significance of ISO standards in Europe has grown, and, in turn, has also increased pressure on the ISO to efficiently produce standards and guidelines for VDUs.
User performance standards
An alternative to product standards is to develop user performance standards. Thus, rather than specify a product feature such as character height which it is believed will result in a legible display, standards makers develop procedures for testing directly such characteristics as legibility. The standard is then stated in terms of the user performance required from the equipment and not in terms of how that is achieved. The performance measure is a composite including speed and accuracy and the avoidance of discomfort.
User performance standards have a number of advantages; they are
- relevant to the real problems experienced by users
- tolerant of developments in the technology
- flexible enough to cope with interactions between factors.
However, user performance standards can also suffer a number of disadvantages. They cannot be totally complete and scientifically valid in all cases, but do represent reasonable compromises, which require significant time to obtain the agreement of all the parties involved in standards-setting.
Coverage and Use of ISO 9241
The VDU ergonomics requirements standard, ISO 9241, provides detail on ergonomic aspects of products, and on assessing the ergonomic properties of a system. All references to ISO 9241 also apply to EN 29241. Some parts provide general guidance to be considered in the design of equipment, software and tasks. Other parts include more specific design guidance and requirements relevant to current technology, since such guidance is useful to designers. In addition to product specifications, ISO 9241 emphasizes the need to specify factors affecting user performance, including how to assess user performance in order to judge whether or not a system is appropriate to the context in which it will be used.
ISO 9241 has been developed with office-based tasks and environments in mind. This means that in other specialized environments some acceptable deviation from the standard may be needed. In many cases, this adaptation of the office standard will achieve a more satisfactory result than the “blind” specification or testing of an isolated standard specific to a given situation. Indeed, one of the problems with VDU ergonomics standards is that the technology is developing faster than standards makers can work. Thus it is quite possible that a new device may fail to meet the strict requirements in an existing standard because it approaches the need in question in a way radically different from any that were foreseen when the original standard was written. For example, early standards for character quality on a display assumed a simple dot matrix construction. Newer more legible fonts would have failed to meet the original requirement because they would not have the specified number of dots separating them, a notion inconsistent with their design.
Unless standards are specified in terms of the performance to be achieved, the users of ergonomics standards must allow suppliers to meet the requirement by demonstrating that their solution provides equivalent or superior performance to achieve the same objective.
The use of the ISO 9241 standard in the specification and procurement process places display screen ergonomics issues firmly on management’s agenda and helps to ensure proper consideration of these issues by both procurer and supplier. The standard is therefore a useful part of the responsible employer’s strategy for protecting the health, safety and productivity of display screen users.
General issues
ISO 9241 Part 1 General introduction explains the principles underlying the multipart standard. It describes the user performance approach and provides guidance on how to use the standard and on how conformance to parts of ISO 9241 should be reported.
ISO 9241 Part 2 Guidance on task requirements provides guidance on job and task design for those responsible for planning VDU work in order to enhance the efficiency and the well-being of individual users by applying practical ergonomic knowledge to the design of office VDU tasks. Objectives and characteristics of task design are also discussed (see figure 2) and the standard describes how task requirements may be identified and specified within individual organizations and can be incorporated into the organization’s system design and implementation process.
Figure 2. Guidance and task requirements
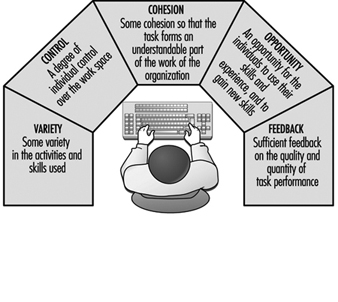
Case Study: Display Screen Equipment Directive (90/270/EEC)
The Display Screen Directive is one in a series of “daughter”directives dealing with specific aspects of health and safety. The directives form part of the European Union’s programme for promoting health and safety in the single market. The “parent” or “Framework” Directive (89/391/EEC) sets out the general principles of the Community’s approach to Health and Safety. These common principles include the avoidance of risk, where possible, by eliminating the source of the risk and the encouragement of collective protective measures instead of individual protective measures.
Where risk is unavoidable, it must be properly evaluated by people with the relevant skills and measures must be taken which are appropriate to the extent of the risk. Thus if the assessment shows that the level of risk is slight, informal measures may be entirely adequate. However, where significant risk is identified, then stringent measures must be taken. The Directive itself only placed obligations on Member States of the EU, not on individual employers or manufacturers. The Directive required Member States to transpose the obligations into appropriate national laws, regulations and administrative provisions. These in turn place obligations on employers to ensure a minimum level of health and safety for display screen users. The main obligations are for employers to: The intention behind the Display Screen Directive is to specify how workstations should be used rather than how products should be designed. The obligations therefore fall on employers, not on manufacturers of workstations. However, many employers will ask their suppliers to reassure them that their products “conform”. In practice, this means little since there are only a few, relatively simple design requirements in the Directive. These are contained in the Annex (not given here) and concern the size and reflectance of the work surface,the adjustability of the chair, the separation of the keyboard and the clarity of the displayed image.
Hardware and environmental ergonomics issues
Display screen
ISO 9241 (EN 29241) Part 3 Visual display requirements specifies the ergonomic requirements for display screens which ensure that they can be read comfortably, safely and efficiently to perform office tasks. Although it deals specifically with displays used in offices, the guidance is appropriate to specify for most applications which require general purpose displays. A user performance test which, once approved, can serve as the basis for performance testing and will become an alternate route to compliance for VDUs.
ISO 9241 Part 7 Display requirements with reflections. The purpose of this part is to specify methods of measurement of glare and reflections from the surface of display screens, including those with surface treatments. It is aimed at display manufacturers who wish to ensure that anti-reflection treatments do not detract from image quality.
ISO 9241 Part 8 Requirements for displayed colours. The purpose of this part is to deal with the requirements for multicolour displays which are largely in addition to the monochrome requirements in Part 3, requirements for visual display in general.
Keyboard and other input devices
ISO 9241 Part 4 Keyboard requirements requires that the keyboard should be tiltable, separate from the display and easy to use without causing fatigue in the arms or hands. This standard also specifies the ergonomic design characteristics of an alphanumeric keyboard which may be used comfortably, safely and efficiently to perform office tasks. Again, although Part 4 is a standard to be used for office tasks, it is appropriate to most applications which require general purpose alphanumeric keyboards. Design specifications and an alternative performance test method of compliance are included.
ISO 9241 Part 9 Requirements for non-keyboard input devices specifies the ergonomic requirements from such devices as the mouse and other pointing devices which may be used in conjunction with a visual display unit. It also includes a performance test.
Workstations
ISO 9241 Part 5 Workstation layout and postural requirements facilitates efficient operation of the VDU and encourages the user to adopt a comfortable and healthy working posture. The requirements for a healthy, comfortable posture are discussed. These include:
- the location of frequently used equipment controls, displays and work surfaces within easy reach
- the opportunity to change position frequently
- the avoidance of excessive, frequent and repetitive movements with extreme extension or rotation of the limbs or trunk
- support for the back allowing an angle of 90 degrees to 110 degrees between back and thighs.
The characteristics of the workplace which promote a healthy and comfortable posture are identified and design guidelines given.
Working environments
ISO 9241 Part 6 Environmental requirements specifies the ergonomic requirements for the visual display unit working environment which will provide the user with comfortable, safe and productive working conditions. It covers the visual, acoustic and thermal environments. The objective is to provide a working environment which should facilitate efficient operation of the VDU and provide the user with comfortable working conditions.
The characteristics of the working environment which influence efficient operation and user comfort are identified, and design guidelines presented. Even when it is possible to control the working environment within strict limits, individuals will differ in their judgements of its acceptability, partly because individuals vary in their preferences and partly because different tasks may require quite different environments. For example, users who sit at VDUs for prolonged periods are far more sensitive to draughts than users whose work involves moving about an office and only working at the VDU intermittently.
VDU work often restricts the opportunities that individuals have for moving about in an office and so some individual control over the environment is highly desirable. Care must be taken in common work areas to protect the majority of users from extreme environments which may be preferred by some individuals.
Software ergonomics and dialogue design
ISO 9241 Part 10 Dialogue principles presents ergonomic principles which apply to the design of dialogues between humans and information systems, as follows:
- suitability for the task
- self-descriptiveness
- controllability
- conformity with user expectations
- error tolerance
- suitability for individualization
- suitability for learning.
The principles are supported by a number of scenarios which indicate the relative priorities and importance of the different principles in practical applications. The starting point for this work was the German DIN 66234 Part 8 Principles of Ergonomic Dialogue Design for Workplaces with Visual Display Units.
ISO 9241 Part 11 Guidance on usability specification and measures helps those involved in specifying or measuring usability by providing a consistent and agreed framework of the key issues and parameters involved. This framework can be used as part of an ergonomic requirements specification and it includes descriptions of the context of use, the evaluation procedures to be carried out and the criterion measures to be satisfied when the usability of the system is to be evaluated.
ISO 9241 Part 12 Presentation of information provides guidance on the specific ergonomics issues involved in representing and presenting information in a visual form. It includes guidance on ways of representing complex information, screen layout and design and the use of windows. It is a useful summary of the relevant materials available among the substantial body of guidelines and recommendations which already exist. The information is presented as guidelines without any need for formal conformance testing.
ISO 9241 Part 13 User guidance provides manufacturers with, in effect, guidelines on how to provide guidelines to users. These include documentation, help screens, error handling systems and other aids that are found in many software systems. In assessing the usability of a product in practice, real users should take into account the documentation and guidance provided by the supplier in the form of manuals, training and so on, as well as the specific characteristics of the product itself.
ISO 9241 Part 14 Menu dialogues provides guidance on the design of menu-based systems. It applies to text-based menus as well as to pull-down or pop-up menus in graphical systems. The standard contains a large number of guidelines developed from the published literature and from other relevant research. In order to deal with the extreme variety and complexity of menu-based systems, the standard employs a form of “conditional compliance”. For each guideline, there are criteria to help establish whether or not it is applicable to the system in question. If it is determined that the guidelines are applicable, criteria to establish whether or not the system meets those requirements are provided.
ISO 9241 Part 15 Command dialogues provides guidance for the design of text-based command dialogues. Dialogues are the familiar boxes which come onto the screen and query the VDU user, such as in a search command. The software creates a “dialogue” in which the user must supply the term to be found, and any other relevant specifications about the term, such as its case or format.
ISO 9241 Part 16 Direct manipulation dialogues deals with the design of direct manipulation dialogues and WYSIWYG (What You See Is What You Get) dialogue techniques, whether provided as the sole means of dialogue or combined with some other dialogue technique. It is envisaged that the conditional compliance developed for Part 14 may be appropriate for this mode of interaction also.
ISO 9241 Part 17 Form-filling dialogues is in the very early stages of development.
Case Study: A Summary of Studies of Reproductive Outcomes
In a case-control study looking at environmental and occupational factors for congenital malformations (Kurppa et al. 1986), 1,475 cases were identified from the Finnish Register of Congenital Malformations during the period between 1976 and 1982 (see table 1). A mother whose delivery immediately preceded a case, and was in the same district, served as a control for that case. Exposure to visual display units (VDUs) during the first trimester of pregnancy was assessed using face-to-face interviews conducted either at the clinic during a post-natal visit, or at home. The classification of probable or obvious VDU use was determined by occupational hygienists, blind to the pregnancy outcomes, using job titles and the responses to open-ended questions asking to describe the ordinary work day. There was no evidence of increased risk either among women who reported exposure to VDUs (OR 0.9; 95% CI 0.6 – 1.2), or among women whose job titles indicated possible exposure to VDUs (235 cases/255 controls).
A cohort of Swedish women from three occupational groups was identified through a linkage of occupational census and the Medical Birth Registry during 1980–1981 (Ericson and Källén 1986). A case-base study was conducted within that cohort: cases were 412 women hospitalized for spontaneous abortion and an additional 110 with other outcomes (such as perinatal death, congenital malformations and birthweight below 1500 g). Controls were 1,032 women of similar age who had infants without any of these characteristics, chosen from the same registry. Using crude odds ratios, there was an exposure–response relation between VDU exposure in estimated hours per week (divided into five-hour categories) and pregnancy outcomes (excluding spontaneous abortion). After controlling for smoking and stress, the effect of VDU use on all adverse pregnancy outcomes was not significant.
Focusing on one of three occupational groups identified from a previous study by Ericson a cohort study was conducted using 4,117 pregnancies among social security clerks in Sweden (Westerholm and Ericson 1986). Rates of hospitalized spontaneous abortion, low birthweight, perinatal mortality and congenital malformations in this cohort were compared to rates in the general population. The cohort was divided into five exposure groups defined by trade union and employer representatives. No excesses were found for any of the studied outcomes. The overall relative risk for spontaneous abortion, standardized for mothers’ age was 1.1 (95% CI 0.8 – 1.4).
A cohort study involving 1,820 births was conducted among women having ever worked at the Norwegian Postal Giro Centre between 1967–1984 (Bjerkedal and Egenaes 1986). The rates of stillbirth, first-week death, perinatal death, low and very low birthweight, preterm birth, multiple births and congenital malformations were estimated for pregnancies occurring during employment at the centre (990 pregnancies), and pregnancies occurring before or after employment at the centre (830 pregnancies). Rates of adverse pregnancy outcomes were also estimated for three six-year periods, (1967–1972), (1973–1978) and (1979–1984). Introduction of VDUs began in 1972, and were extensively used by 1980. The study concluded that there was no indication that introduction of VDUs in the centre had led to any increase in the rate of adverse pregnancy outcomes.
A cohort of 9,564 pregnancies was identified through logs of urine pregnancy tests from three California clinics in 1981–1982 (Goldhaber, Polen and Hiatt. 1988). Coverage by a Northern California medical plan was a requirement to be eligible for the study. Pregnancy outcomes were found for all but 391 identified pregnancies. From this cohort, 460 of 556 spontaneous abortion cases (<28 weeks), 137 of 156 congenital abnormality cases and 986 of 1,123 controls (corresponding to every fifth normal birth in the original cohort), responded to a retrospective postal questionnaire on chemical environmental exposures including pesticides and VDU use during pregnancy. Odds ratios for women with first trimester VDU use over 20 hours per week, adjusted for eleven variables including age, previous miscarriage or birth defect, smoking and alcohol, were 1.8 (95% CI 1.2 – 2.8) for spontaneous abortion and 1.4 (95% CI 0.7 – 2.9) for birth defects, when compared to working women who did not report using VDUs.
In a study conducted in 11 hospital maternity units in the Montreal area over a two-year period (1982–1984), 56,012 women were interviewed on occupational, personal and social factors after delivery (51,855) or treatment for spontaneous abortion (4,127) (McDonald et al. 1988).These women also provided information on 48,637 previous pregnancies. Adverse pregnancy outcomes (spontaneous abortion, stillbirth, congenital malformations and low birthweight) were recorded for both current and previous pregnancies. Ratios of observed to expected rates were calculated by employment group for current pregnancies and previous pregnancies. Expected rates for each employment group were based on the outcome in the whole sample, and adjusted for eight variables, including age, smoking and alcohol. No increase in risk was found among women exposed to VDUs.
A cohort study comparing rates of threatened abortion, length of gestation, birthweight, placental weight and pregnancy-induced hypertension between women who used VDUs and women who did not use VDUs was carried out among 1,475 women (Nurminen and Kurppa 1988).The cohort was defined as all non-cases from a previous case-control study of congenital malformations. Information about risk factors was collected using face-to-face interviews. The crude and adjusted rate ratios for the outcomes studied did not show statistically significant effects for working with VDUs.
A case-control study involving 344 cases of hospitalized spontaneous abortion occurring at three hospitals in Calgary, Canada, was conducted in 1984–1985 (Bryant and Love 1989). Up to two controls (314 prenatal and 333 postpartum) were chosen among women having delivered or susceptible of delivering at the study hospitals. The controls were matched to each case on the basis of age at last menstrual period, parity, and intended hospital of delivery. VDU use at home and at work, before and during pregnancy, was determined through interviews at the hospitals for postnatal controls and spontaneous abortion, and at home, work, or the study office for prenatal controls. The study controlled for socioeconomic and obstetric variables. VDU use was similar between the cases and both the prenatal controls (OR=1.14; p=0.47) and postnatal controls (OR=0.80; p=0.2).
A case-control study of 628 women with spontaneous abortion, identified through pathology specimen submissions, whose last menstrual period occurred in 1986, and 1,308 controls who had live births, was carried out in one county in California (Windham et al. 1990). The controls were randomly selected, in a two-to-one ratio, among women matched for date of last menstrual period and hospital. Activities during the first 20 weeks of pregnancy were identified through telephone interviews. The participants were also asked about VDU use at work during this period. Crude odds ratios for spontaneous abortion and VDU use less than 20 hours per week (1.2; 95% CI 0.88 – 1.6), and at least 20 hours per week (1.3; 95% CI 0.87 – 1.5), showed little change when adjusted for variables including employment group, maternal age, prior foetal loss, alcohol consumption and smoking. In a further analysis among the women in the control group, risks for low birthweight and intrauterine growth retardation were not significantly elevated.
A case-control study was conducted within a study base of 24,352 pregnancies occurring between 1982 and 1985 among 214,108 commercial and clerical employees in Denmark (Brandt and Nielsen 1990). The cases, 421 respondents among the 661 women who gave birth to children with congenital abnormalities and who were working at the time of pregnancy, were compared to 1,365 respondents among the 2,252 randomly selected pregnancies among working women. Pregnancies, and their outcomes, and employment were determined through a linkage of three databases. Information on VDU use (yes/no/hours per week), and job-related and personal factors such as stress, exposure to solvents, life-style and ergonomic factors were determined through a postal questionnaire. In this study, the use of VDUs during pregnancy was not associated with an increased risk of congenital abnormalities.
Using the same study base as in the previous study on congenital abnormalities (Brandt and Nielsen 1990) 1,371 of 2,248 women whose pregnancies ended in a hospitalized spontaneous abortion were compared to 1,699 randomly selected pregnancies (Nielsen and Brandt 1990). While the study was carried out among commercial and clerical workers, not all of the pregnancies corresponded to times when the women were gainfully employed as commercial or clerical workers. The measure of association used in the study was the ratio of the rate of VDU use among women with a spontaneous abortion to the rate of VDU use among the sample population (representing all pregnancies including those ending in spontaneous abortion). The adjusted rate ratio for any exposure to VDU and spontaneous abortion was 0.94 (95% CI 0.77 – 1.14).
A case-control study was carried out among 573 women who gave birth to children with cardiovascular malformations between 1982 and 1984 (Tikkanen and Heinonen 1991). The cases were identified through the Finnish register of congenital malformations. The control group consisted of 1,055 women, randomly selected among all hospital deliveries during the same time period. VDU use, recorded as never, regular or occasional, was assessed through an interview conducted 3 months after the delivery. No statistically significant association was found between VDU use, at work or at home, and cardiovascular malformations.
A cohort study was carried out among 730 married women who reported pregnancies between 1983 and 1986 (Schnorr et al. 1991). These women were employed as either directory assistance operators or as general telephone operators at two telephone companies in eight southeastern states in the United States. Only the directory assistance operators used VDUs at work. VDU use was determined through company records. Spontaneous abortion cases (foetal loss at 28 weeks’ of gestation or earlier) were identified through a telephone interview; birth certificates were later used to compare women’s reporting with pregnancy outcomes and when possible, physicians were consulted. Strengths of electric and magnetic fields were measured at very low and extremely low frequencies for a sample of the workstations. The VDU workstations showed higher field strengths than those not using VDUs. No excess risk was found for women who used VDUs during the first trimester of pregnancy (OR 0.93; 95% CI 0.63 – 1.38), and there was no apparent exposure–response relation when looking at time of VDU use per week.
A cohort of 1,365 Danish commercial and clerical workers who were gainfully employed at the time of pregnancy, and identified through a previous study (Brandt and Nielsen 1990; Nielsen and Brandt 1990), was used to study fecundability rates, in relation to VDU use (Brandt and Nielsen 1992). Fecundability was measured as time from stopping birth control use to time of conception, and was determined through a postal questionnaire. This study showed an increased relative risk for prolonged waiting to pregnancy for the subgroup with at least 21 weekly hours of VDU use. (RR 1.61; 95% CI 1.09 – 2.38).
A cohort of 1,699 Danish commercial and clerical workers, consisting of women employed and unemployed at the time of pregnancy, identified through the study reported on in the previous paragraph, was used to study low birthweight (434 cases), preterm birth (443 cases), small for gestational age (749 cases), and infant mortality (160 cases), in relation to VDU use patterns (Nielsen and Brandt 1992). The study failed to show any increased risk for these adverse pregnancy outcomes among women with VDU use.
In a case-control study, 150 nulliparous women with clinically diagnosed spontaneous abortion and 297 nulliparous working women attending a hospital in Reading, England for antenatal care between 1987 and 1989 were interviewed (Roman et al. 1992). The interviews were conducted face to face at the time of their first antenatal visit for the controls, and three weeks after the abortion for women with spontaneous abortion. For women who mentioned VDU use, estimates of time of exposure in hours per week, and calendar time of first exposure were assessed. Other factors such as overtime, physical activity at work, stress and physical comfort at work, age, alcohol consumption and previous miscarriage were also assessed. Women who worked with VDUs had an odds ratio for spontaneous abortion of 0.9 (95% CI 0.6 – 1.4), and there was no relation with the amount of time spent using VDUs. Adjusting for other factors such as maternal age, smoking, alcohol and previous spontaneous abortion did not alter the results.
From a study base of bank clerks and clerical workers in three companies in Finland, 191 cases of hospitalized spontaneous abortion and 394 controls (live births) were identified from Finnish medical registers for 1975 to 1985 (Lindbohm et al. 1992). Use of VDUs was defined using workers’ reports and company information. Magnetic field strengths were retrospectively assessed in a laboratory setting using a sample of the VDUs which had been used in the companies. The odds ratio for spontaneous abortion and working with VDUs was 1.1 (95% CI 0.7 – 1.6). When VDU users were separated in groups according to the field strengths for their VDU models, the odds ratio was 3.4 (95% CI 1.4 – 8.6) for workers who had used VDUs with a high magnetic field strength in the extremely low frequency bandwidth (0.9 μT), compared to those working with VDUs with field strength levels below the detection limits (0.4 μT). This odds ratio changed only slightly when adjusted for ergonomic and mental work-load factors. When comparing workers exposed to high magnetic field strengths to workers not exposed to VDUs, the odds ratio was no longer significant.
A study, looking at adverse pregnancy outcomes and fertility, was carried out among female civil servants working for the British Government tax offices (Bramwell and Davidson 1994). Of the 7,819 questionnaires mailed in the first stage of the study, 3,711 were returned. VDU use was determined through this first questionnaire. Exposure was assessed as hours per week of VDU use during pregnancy. One year later, a second questionnaire was sent out to assess the incidence of adverse pregnancy outcomes among these women; 2,022 of the original participants responded. Possible confounders included pregnancy history, ergonomic factors, job stressors, caffeine, alcohol, cigarette and tranquillizer consumption. There was no relationship between exposure as assessed one year previously and the incidence of adverse pregnancy outcomes.
" DISCLAIMER: The ILO does not take responsibility for content presented on this web portal that is presented in any language other than English, which is the language used for the initial production and peer-review of original content. Certain statistics have not been updated since the production of the 4th edition of the Encyclopaedia (1998)."